


Manager's Guide to Distribution Costs 2026
The 8th annual benchmark of commercial vehicle operating costs, overheads and market trends
Download

Manager's Guide to Distribution Costs 2026 - Ireland
Now on its 8th edition. Published September 2026 and partnered by FTA Ireland, AIB and ECOfleet with primary research undertaken by Analytiqa. This report is based on a survey of Irish freight, distribution and logistics operators, conducted during Q2 2026.
Key findings: Ireland's distribution costs in 2026
- Irish freight and logistics operators surveyed reported average revenue growth of 8.3% and average operating margin of 7.5%.
- Business overheads rose by 7.3% on average and transport overheads by 8.1%, while domestic haulage rates rose by only 2.7%.
- Fuel accounts for 46.3% of operating costs for a 46-tonne articulated vehicle, and drivers for 32.6%.
- Driver vacancies take an average of 30.7 working days to fill, and 47.5% of drivers are aged 51 or over.
- Average driver salaries rose by 5.5% within the companies surveyed.
- One-third of respondents delayed or changed capital expenditure plans in response to events in the Middle East.
(NB: The respondent base changes annually so the report consequently avoids calculating year-on-year growth rates for many measures and does not infer a rise or fall unless an annual growth rate is specifically provided. The report is a useful operator benchmark against comparable fleet operations and to identify directional cost pressures, not as a definitive national average or forecast.)
Contents
- Foreword
- Introduction
- Methodology & respondents
- FTA Ireland: Key policy priorities
- Ireland’s distribution costs at a glance
- Headline trends
- Sustainable finance
- Finance
- Truck operating analysis
- Comparative analysis by vehicle type
- Tyre landscape overview
- Procurement, energy & eco training
- Decarbonising Ireland’s freight & logistics
- Employment, wages & training
- Transport operations & commercial driving apprenticeships
- Training
- Data tables (Downloaded report only)
- Market data appendix (Downloaded report only)
Foreword
I am very pleased to have been asked to write the foreword for this, the eight edition of the Freight Transport Association of Ireland (FTA Ireland) Manager’s Guide to Distribution Costs. Both I and my officials have found the report a useful and engaging reference point. This publication is a valuable resource for fleet operators across the sector, providing both a snapshot of the current environment, as well as demonstrating trends across the years which can help businesses to plan and grow.
Unsurprisingly, this year’s report has shown that a large majority of respondents are seeing increases in their total business and transport overhead costs. This year has been a particularly challenging economic environment, with global unrest leading to sustained and dramatic increases in the price of fuel. I note that 84.6 percent of respondents suggest that fuel price changes have had a ‘significant’ or ‘moderate’ impact on their operating costs. The Government recognises the uniquely difficult pressures that the Road Freight sector faces when fuel prices surge and has introduced general measures, such as reductions in the rate of excise and the NORA levy, as well as targeted sector specific measures such as the increase in the maximum rebate available to licensed operators under the Diesel Rebate Scheme from 7.5 cent to 12 cent.
In addition, in recognition of the essential role played by Ireland’s supply chains, the Government announced the operation of the Road Transporters Support Scheme (RTSS). The RTSS made funding of up to €120 million available to help road transport businesses offset escalating fuel costs. The scheme has a bigger budget and was available to a wider spectrum of operators than the Licensed haulage support schemes that were operated previously. A total of 4,406 applications were received in respect of 31,509 vehicles. 2,264 of applications were made by licensed road haulage operators, 456 of applications were made by licensed road passenger and 1,686 of applications were made by own-account operators.
I am heartened to see that, despite the complexities faced by the sector, respondents reported an average of 8.3 percent growth in revenue, achieving an average operating profit margin of 7.5 percent. While the margins remain narrow I think it’s important that we recognise that thanks to the expertise and professionalism I see daily within the sector, it remains solid and resilient.
This report identifies that filling driver vacancies persists as a concern for respondents. The number of days taken to fill a vacancy has continued to increase and it is an ongoing challenge to which this Government has brought a renewed focus. FTA Ireland are a valued partner in the effort to attract drivers from non-EEA countries to ease these recruitment challenges. The work done by FTA Ireland on documenting the process of recruitment from abroad to help relieve the shortage was an important and valuable step and my officials are engaging with other Departments to speed up that process.
Logistics and Supply Chain Skills Week 2027 will take place next year from Monday 19 to Saturday 24 April. I would like to invite all FTAI members to take an active role in the events taking place to ensure a successful and engaging week. The themes of the week will remain, ‘Global, Innovative and Resilient’. A particular highlight of the week for me is the LogisTYcs Expo for Transition Year students, Leaving Cert Applied students, their guidance counsellors, and teachers, which takes place next year on Thursday 22 April. The event is a wonderful opportunity to attract young people and get them excited about the careers available.
As we move closer to our 2030 climate targets, I am encouraged to see that over 90 percent of survey respondents now have sustainability policies in place. The biggest driver behind these efforts has been identified as the need to ‘meet expectations or requirements of customers, suppliers or service providers’.
This demonstrates how a strong commitment to reduce emissions and move towards a net zero future has become normalised and indeed is expected by customers.
I do however recognise that there is bias towards larger operators in the survey response and there is still a lot for the Government to do to assist, in particular, smaller operators in preparing for the transition. Once again, the expense of implementing green initiatives remains the biggest obstacle survey respondents perceive in their efforts to be more sustainable, with 80 percent identifying ‘Financial Cost’ as the biggest barrier.
This Government provides support to operator’s efforts to be more sustainable via the Zero Emission Heavy Duty Vehicle Purchase Grant Scheme. The scheme provides support for zero emission vehicles as well as for associated charging infrastructure. In addition, the SEAI administers the fleet assessment scheme which provides your organisation with an experienced assessor who will examine your current fleet and assist in identifying a pathway to fleet electrification. Electrification will play an important role in the transition to a zero emission sector, but I would also encourage operators to consider what role Hydrogen or Biomethane could play for their fleets.
This coming year will be an important milestone for my Department as we carry out the midpoint review of the Ireland’s Road Haulage Strategy 2022-2031. This process will include consultation with stakeholders to review existing actions, and we would welcome specific input from industry on how the Government can support decarbonisation not only through expanding subsides, but also through support for interim technologies which will reduce emissions in the short and medium term. I would like to encourage FTA Ireland members to engage with the process to best ensure the collaborative relationship we have developed continues to prosper.
Seán Canney T.D., Minister of State at the Department of Transport with special responsibility for International and Road Transport, Logistics, Rail and Ports

Introduction
FTA Ireland, in partnership with AIB, ECOfleet, Logistics Associate Apprenticeship and supported by specialist research agency Analytiqa, is pleased to present the eighth annual Manager’s Guide to Distribution Costs.
Since 2019, the report has provided an independent, practical evidence base for Ireland’s freight distribution, logistics and commercial fleet sectors. It tracks vehicle operating costs and the wider factors shaping performance and investment. That broader context is especially important in 2026. Freight and logistics businesses continue to face geopolitical instability, energy-market volatility and cost uncertainty. Recent pressures show how quickly international events affect domestic operations. Fuel-price movements feed directly into operating costs, working capital, customer pricing and confidence. For a sector that must keep vehicles moving daily, these pressures cannot be deferred. This year’s report explores how operators are responding. New questions cover business sentiment, fuel-price increases, pricing and surcharge adjustments, contractual fuel baselines and experience of the Road Transport Support Scheme. The research also considers impacts on capital expenditure, staffing, alternative-fuel priorities and customer delivery requirements. The findings show a resilient sector, but one that is becoming more selective about when and where it invests. Business overheads increased by an average of 7.3%, while transport overheads rose by 8.1%. Domestic haulage rates increased by only 2.7%. This continuing gap between cost growth and recoverable rates is placing pressure on margins and reinforces the need for fair, transparent and regularly reviewed commercial arrangements.
Energy costs remain central. More than eight in ten respondents said fuel-price changes had a significant or moderate impact on operating costs. Operators have responded through pricing changes, fuel surcharges and revised contractual baselines, although the effectiveness of these measures varies. One-third delayed asset purchases or changed capital expenditure plans directly in response to events in the Middle East. The proportion with no capital expenditure planned for the coming year also rose from 7.7% in 2025, to 21.4% in 2026. This matters beyond individual businesses. Delayed replacement may affect fleet age, maintenance, reliability, emissions and the introduction of newer technologies.
However, the picture is not entirely defensive. Among businesses continuing to invest, fleet replacement remains the principal priority, with technology, machinery and equipment also featuring strongly. Alternatively fuelled vehicles are now present in 60.0% of participating fleets, up from 52.9% in 2025, and user satisfaction has improved. Expectations for the overall scale of alternatively fuelled fleets by 2030 have nevertheless become more cautious, highlighting the difference between trialling vehicles and committing to wider fleet conversion. The report also broadens its assessment of business preparedness. It considers climate-related operational risks, future energy needs, cyber-risk training, driver welfare, employment-status arrangements, empty running and collaboration with customers. Fleet performance can no longer be assessed through vehicle costs alone. Energy capacity, workforce availability, digital resilience, infrastructure and management capability are increasingly important to competitiveness.
Recruitment remains a persistent challenge. More than three-quarters of respondents say recruitment difficulties affect day-to-day operations, while 71.4% report an impact on business growth. Driver vacancies take an average of 30.7 working days to fill, and fewer than one in five drivers in participating fleets are aged 40 or younger. These findings underline the importance of retention, training, apprenticeships and a sustainable talent pipeline. There are also clear efficiency opportunities. Telematics is used by every respondent, yet feedback identifies continued reliance on fragmented systems, spreadsheets, manual reporting and disconnected information. The priority is not simply to collect more data, but to convert existing information into better operational decisions, fuel management, compliance and utilisation of vehicles and people.
The Manager’s Guide to Distribution Costs helps operators benchmark performance, test assumptions and make informed decisions. It also helps stakeholders understand the costs and challenges of safe, compliant and sustainable freight operations. The findings reinforce the need for cost movements to be understood across the supply chain, procurement decisions to recognise operator viability, and public supports to be practical, accessible and capable of giving businesses confidence to invest.
Niall Cotton, CEO, FTA Ireland

Methodology & respondents
The ‘Manager’s Guide to Distribution Costs’ report is now celebrating its eighth year. Since 2019, the unique insight and analysis provided within these pages has, and continues to benefit operational, commercial and strategic planning for any organisation with an interest in logistics, supply chain and, more specifically, road transport, across Ireland.
Research was undertaken by Analytiqa, with responses from fleet operators collected between June and August 2026. The number of respondents was broadly in line with previous reports. However, as always, the composition of the respondents varies, as exactly the same companies do not participate each year. Once again, to ensure strict confidentiality and independence, only Analytiqa has access to individual company responses and the operational data they provide. Participating companies of all sizes manage and / or sub-contract transport fleets, both domestically and internationally, encompassing own-account operators and third-party service providers.
Our respondents were broadly classified in three groups, as logistics operators, road hauliers or manufacturers and retailers.
Understanding our research respondents
Of the respondents to this year’s research, 42.3% provide haulage services to customers (including sub-contracted services to other logistics and transport companies), with 26.9% managing fleets as own-account operators. 30.8% of respondents are described as logistics companies. The transport fleets operated by our research respondents support the success of a significant share of Ireland’s economy, across a wide variety of industries, including the agriculture, automotive, construction, consumer goods, eCommerce, food and drinks, industrial manufacturing, pharmaceutical and healthcare, retail, technology, utilities, energy & waste sectors.
The fleet sizes of our respondents, and the distances they travel, are higher than one might expect from the industry average.
This has been a consistent feature of our analysis each year. It is important to keep this in mind, as understanding this will help provide context for the analysis included throughout this report. The market data appendix at the end of this report provides a series of data points to support our research findings. Included amongst these are average fleet sizes.
The changing composition of our research audience from year to year means that there will inevitably be some disparities between individual datapoints each year. For this reason, we have largely avoided the calculation of growth rates between periods, instead focussing on a more holistic approach. Unless annual growth rates are provided for a data set, readers should not interpret a change in a data point from one year to the next as a rise or fall in a particular metric.
Across the charts and data tables included in this year’s report consistent trends do emerge amongst our respondent base. This year, our respondents average fleet size (vehicles) is just over 45, whilst the average distance travelled per vehicle (across all truck types) per year, is 87,037 km, …equating to a distance per ‘working day’ of (excl. Sundays and Bank Holidays) of 288.2 km.
FTA Ireland: Key policy priorities
FTA Ireland continues to work to ensure that Ireland’s freight, distribution, passenger transport and logistics sector remains competitive, resilient and capable of meeting the major changes ahead. Its policy priorities reflect the practical challenges facing operators, including rising costs, skills shortages, infrastructure constraints, energy-price volatility and the transition to lower-emission transport.
An essential part of Ireland’s economy
Recognition of the sector as essential economic infrastructure remains central to this work. Freight and logistics connect businesses with domestic and international markets and enable the movement of food, medicines, construction materials, industrial inputs and consumer goods. Reliable transport also supports regional development, public services and Ireland’s competitiveness as an exporting economy. The 2026 Manager’s Guide to Distribution Costs highlights the pressure on operators. Business overheads increased by an average of 7.3%, while transport overheads rose by 8.1%. Domestic haulage rates increased by only 2.7%, leaving many businesses unable to recover the full additional costs incurred. Fuel-price movements had a moderate or significant impact on operating costs for more than four out of five respondents.
These findings reinforce the case made in FTA Ireland’s Pre-Budget Submission 2027 that freight, passenger transport and logistics must be treated as essential economic infrastructure. Transport cost increases ultimately affect manufacturers, retailers, exporters, public services and consumers. Decisions on taxation, energy, infrastructure and regulation must therefore consider their effects on transport capacity, supply-chain resilience and national competitiveness.
Supporting a practical energy transition
The Pre-Budget Submission calls for focused measures to protect essential transport capacity while accelerating realistic decarbonisation. A central proposal is a Commercial Transport Energy Rebate to replace and broaden the existing Diesel Rebate Scheme. It would recognise electricity, HVO, BioCNG, biomethane and hydrogen, alongside qualifying diesel during the transition. Enhanced support could be linked to verified emissions reductions achieved through cleaner fuels, telematics, audited fuel management and certified EcoDriving. Decarbonisation is one of the sector’s most significant long-term challenges. FTA Ireland supports Ireland’s climate ambitions, but the transition must be commercially realistic, operationally practical and accessible to operators of all sizes. No single technology can meet every duty cycle. Vehicle weight, payload, journey length, utilisation, route conditions, depot access and infrastructure availability will determine the most appropriate solution.
Battery-electric vehicles will be central for many operations. Biomethane and BioCNG, certified sustainable HVO, renewable hydrogen and operational efficiency measures also have roles, particularly where zero-emission vehicles or supporting infrastructure are not yet commercially viable. In its response on the next Climate Action Plan, FTA Ireland called for a technology-inclusive pathway combining ambitious targets with practical delivery.
Renewable fuels should not displace zero-emission vehicles where they are suitable, but can achieve meaningful lifecycle emissions reductions for the existing fleet and harder-to-electrify operations during the transition. The 2026 research shows progress alongside continuing uncertainty. Some 60.0% of respondents now operate alternatively fuelled vehicles, up from 52.9% in 2025, while average satisfaction increased from 4.8 to 7.5 out of ten. However, 57.1% of operators yet to adopt them have no confirmed investment timetable. High vehicle prices, limited grid information, charging availability, infrastructure costs, battery life and uncertain residual values continue to weaken confidence. Support must therefore extend beyond vehicle purchase grants. Operators need multi-annual funding certainty, depot assessments, accelerated grid connections, commercially viable charging and dependable refuelling infrastructure. Smaller and regional operators require particular attention because they have less capacity to absorb higher capital costs, infrastructure investment, downtime and residual-value risk.
Infrastructure, ports and freight connectivity
Infrastructure is the decisive enabler. Vehicle grants alone will not deliver fleet transition if operators cannot secure the necessary energy connections.
FTA Ireland is calling for commercial transport energy infrastructure to be recognised as critical infrastructure, including depot connections, HGV charging hubs, BioCNG and biomethane facilities, hydrogen refuelling and low-carbon freight corridors linking ports, airports, logistics parks and major distribution centres.
Decisions should be based on real freight movements and operational requirements, including duty cycles, regional routes, parking and dwell times, and whether vehicles return to a central depot. Better coordination is required between Government, energy providers, local authorities, ports, infrastructure operators and the freight sector. Secure sharing of aggregated freight data could identify priority locations, demonstrate likely utilisation and reduce investment risk. Ireland’s ports are also critical national assets. Approximately 90.0% of Ireland’s traded goods move through the commercial port network, making capacity, connectivity and resilience fundamental to the economy. In its contribution to the National Ports Policy consultation, FTA Ireland emphasised efficient road access, commercially viable rail and intermodal connections, improved digital integration and preparation for future charging and alternative-fuel needs.
The final policy should recognise the different roles and development needs of ports across the network. Investment must reflect freight demand, available capacity, regional development and the needs of exporters, importers, hauliers and shipping services. Where port space or grid capacity is constrained, nearby energy and logistics hubs may provide a practical alternative.
Bioeconomy, skills and workforce
FTA Ireland has also contributed to Ireland’s Bioeconomy Strategy consultation. A successful bioeconomy will depend on efficient logistics to collect and move feedstocks, recovered materials, renewable fuels and higher-value biobased products. Transport, renewable energy and circular-economy policies must therefore be developed together.
Domestic biomethane production can support agricultural emissions reduction, rural development and energy security while providing a lower-carbon fuel for suitable heavy-duty transport. Operators will invest only where there is long-term confidence in fuel availability, sustainability certification, refuelling infrastructure and price competitiveness. Transport must be recognised as an enabler of the bioeconomy, not simply an end user.
Skills and workforce development are equally important. More than seven out of ten respondents report that recruitment challenges affect business growth, while 76.9% say they affect daily operations. Driver vacancies take an average of 30.7 working days to fill, and fewer than one in five drivers are aged 40 or younger. FTA Ireland supports structured career pathways through the Logistics Associate Apprenticeship and Commercial Driver Apprenticeship Programme. Its Pre-Budget Submission also calls for greater National Training Fund investment in apprenticeships, EcoDriving, fleet efficiency, alternative-fuel technologies, transport management and digital resilience. The transition requires skilled drivers, technicians, fleet managers, planners and compliance specialists, together with expertise in energy management, high-voltage systems, data analysis and cybersecurity.
Safety, standards and delivery
Safety, compliance and fair competition remain defining priorities. Operators investing in road-worthiness, driver training, telematics and independently audited systems should not be commercially disadvantaged by unsafe or non-compliant activity. FTA Ireland will continue to promote high standards through TruckSafe, VanSafe and PassengerSafe and seek effective enforcement that protects responsible operators and all road users.
The breadth of FTA Ireland’s recent work across Budget 2027, climate action, the bioeconomy and national ports policy reflects the pace of change affecting the sector. It also demonstrates the commitment of members who provide operational evidence and practical expertise to inform these consultations. The priority now is delivery. Strategies must be supported by clear responsibilities, realistic funding, measurable milestones and transparent progress reporting. FTA Ireland will continue to provide a constructive, evidence-based voice for its members, supporting policies that protect competitiveness, strengthen essential supply chains and deliver a practical transition to safer, more efficient and lower-emission transport.
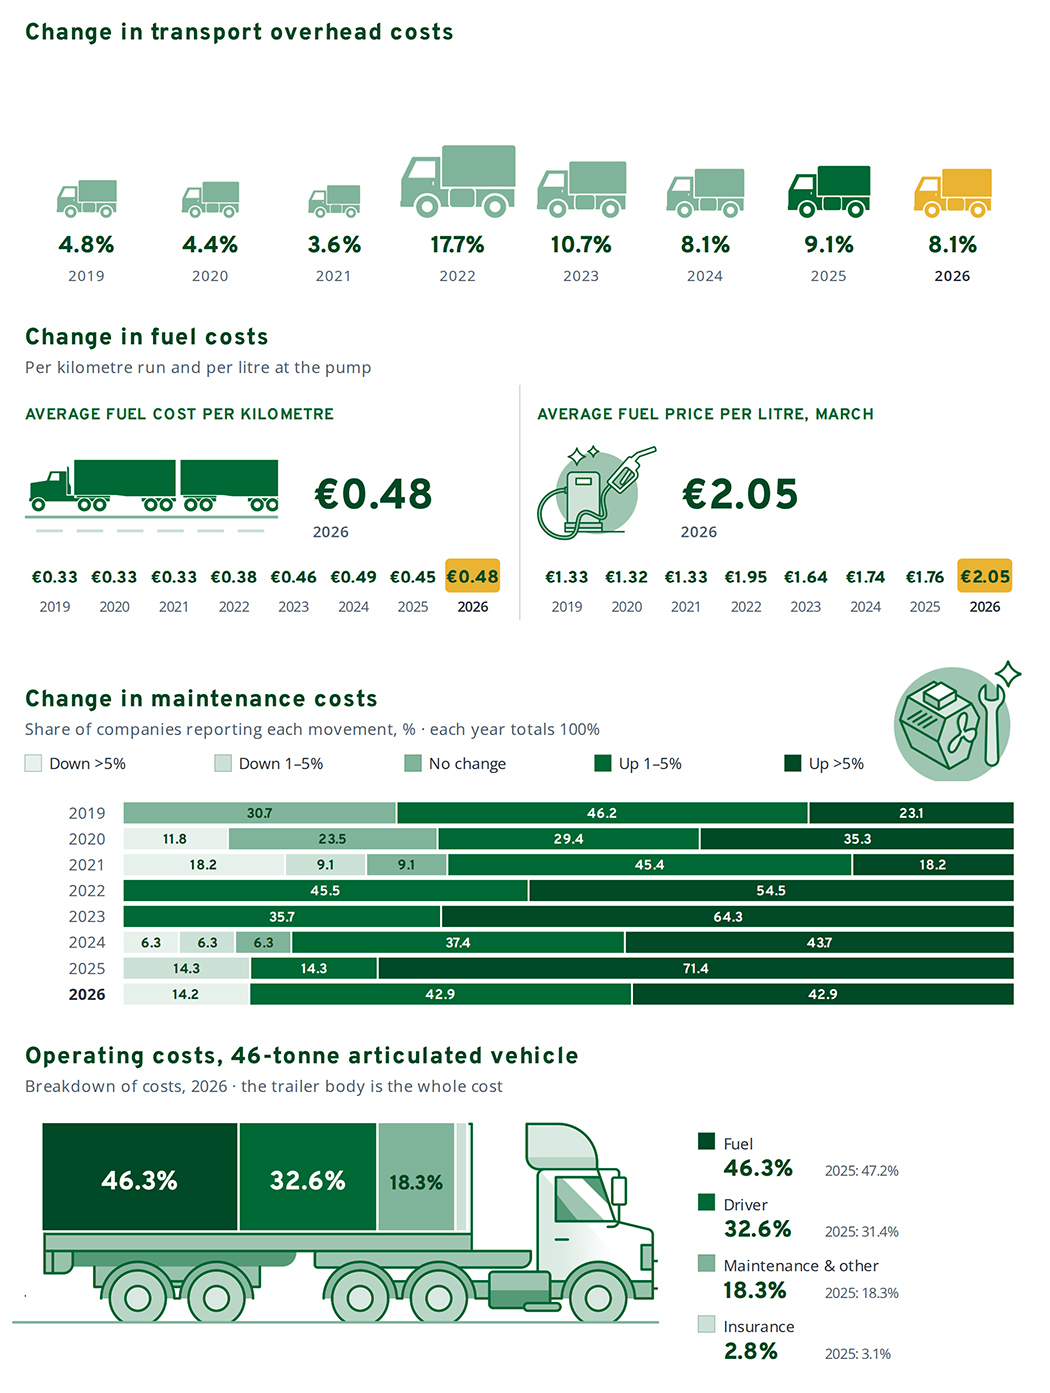
Ireland's distribution costs at a glance
Headline trends
In this section, we provide an overview of a commercial vehicle operator’s costs in Ireland, with a focus on business overheads, transport overheads, maintenance and fuel costs. Additionally, and new for this year, we track respondents’ sentiment on key current challenges facing the sector.
Business overhead costs
In 2026, none of our respondents have reported decreases in their total business overhead costs in the last year. Almost nine-out-of-ten companies that took part in our research (85.7%) have reported an increase in business overheads in the last year, with 14.2% experiencing an increase of more than 10.0%. The average increase in business overhead costs reached 7.3% this year, down marginally from 7.6% in 2025.
Annual business overheads were defined as those involved in running the business, distinct from the costs involved in running the transport operation itself, and included, for example, the cost of renting office space, salaries of administration, sales, marketing and accounting personnel, and utilities bills such as water, electricity and gas etc.
Historically, across our series of reports, the cost increases experienced by our respondents compare unfavourably with the published rate of inflation in Ireland (Consumer Price Index). The Consumer Price Index (CPI) rose by 2.7% between January 2025 and January 2026, down from an annual increase of 2.8% in the 12 months to December 2025. Prices on average, as measured by the CPI, were 3.4% higher in July 2026 compared with July 2025. More details on inflation rates can be viewed in the market data appendix at the end of the report.
| TABLE 3: Change in business overhead costs | ||||||||
| 2019 | 2020 | 2021 | 2022 | 2023 | 2024 | 2025 | 2026 | |
| More than 5% decrease | 0.0% | 0.0% | 8.3% | 0.0% | 0.0% | 0.05 | 0.0% | 0.0% |
| 1-5% decrease | 0.0% | 5.9% | 16.7% | 0.0% | 0.0% | 6.7% | 9.1% | 0.0% |
| No change | 0.0% | 5.9% | 0.0% | 0.0% | 0.0% | 0.0% | 0.0% | 14.3% |
| 1-5% increase | 50.0% | 52.9% | 41.7% | 6.7% | 6.7% | 40.0% | 27.3% | 14.3% |
| More than 5% increase | 50.0% | 35.3% | 33.3% | 93.3% | 93.3% | 53.3% | 63.6% | 71.4% |
| Total | 100.0% | 100.0% | 100.0% | 100.0% | 100.0% | 100.0% | 100.0% | 100.0% |
Transport overhead costs
Similar to our research across the 2022-2025 period, none of the companies participating in 2026 experienced a decline in transport overhead costs in the last year. Over three-quarters of companies (77.8%) reported that their transport costs increased by more than 5.0% and one-third (33.4%) suggested that the increase was 10.0% or more. On average, transport overhead costs were reported to have increased by 8.1% in the last year, down from 9.1% in the prior year period.
Transport overheads are those associated with the day-to-day running of the transport operation and include, for example, the transport manager’s salary, despatch office running costs, tachograph analysis costs, maintenance of fuel storage tanks etc.
To put these cost increases in context, data included in the market data appendix at the end of this report identifies that laden transport journeys across Ireland increased by 10.9% in 2025, as volumes (tonnes carried) increased by 2.4%.
| TABLE 5: Change in transport overhead costs | ||||||||
| 2019 | 2020 | 2021 | 2022 | 2023 | 2024 | 2025 | 2026 | |
| More than 5% decrease | 8.3% | 10.5% | 9.1% | 0.0% | 0.0% | 0.05 | 0.0% | 0.0% |
| 1-5% decrease | 0.0% | 0.0% | 9.1% | 0.0% | 0.0% | 6.7% | 9.1% | 0.0% |
| No change | 0.0% | 10.5% | 9.1% | 0.0% | 0.0% | 6.3% | 0.0% | 0.0% |
| 1-5% increase | 50.0% | 42.2% | 45.5% | 16.7% | 20.0% | 25.0% | 33.3% | 22.2% |
| More than 5% increase | 41.7% | 36.8% | 27.3% | 83.3% | 80.0% | 68.7% | 66.7% | 77.8% |
| Total | 100.0% | 100.0% | 100.0% | 100.0% | 100.0% | 100.0% | 100.0% | 100.0% |
Revenue, profit and haulage rates
The increase in business and transport overhead costs should be placed in context with any increase in prices (rates) that service providers are able to achieve with customers and subsequent changes in revenue and profits. Whilst haulage rates are increasing year-on-year for many fleet operators, but not all, at 2.7%, the average percentage change in domestic haulage rates achieved by our respondents remains significantly below the reported increases in transport operating costs.
For the third time in our series of reports, we asked respondents to provide details of revenue growth and profit margin for their most recent financial accounting period. Whilst not indicative of industry-wide averages, it does help place our analysis of costs in context.
Our respondents reported 8.3% growth in revenue, on average, down marginally from 8.7% last year, achieving an average operating profit margin of 7.5%, up from 6.8%.
Attempting to illustrate the competitive nature of road transport in Ireland, this year, for the first time in our series of reports, respondents disclosed that, on average, 2.6% of work (revenues) have been lost in the last year due to rate / price undercutting by competitors. Respondents suggested that 1.4% of work (revenues) have been lost due to “below cost” undercutting rates.
72.7% of our respondents consider themselves to be ‘buyers’ of haulage services, including companies that sub-contract work. Just over one-third (36.4%) aim to boost the efficiency of their operations by making use of return load rates.
More than nine-out-of-ten of our respondents (91.7%) classify themselves as providers of haulage services, including those that work as sub-contractors and / or own-account operators that may undertake some work for third parties. Of these companies, the average number of customers per company is 65.1, whilst just under one-half (45.5%) offer return load rates to customers.
18.2% of overall respondents that are providers of haulage services undertake cabotage, whilst 25.0% of our respondents identifying themselves as road hauliers are undertaking cabotage.
This year, for the first time in our series of reports, we investigated ‘empty running’ by Ireland’s fleet operators. Respondents disclosed the share of kilometres travelled by their fleet that they would define as ‘empty runs’. On average, they suggested that 12.5% of their distances would be defined as such. This figure is somewhat below other available metrics, so should be treated with caution, and is a data point to keep an eye on in future editions.
On a positive note, 60.0% of our respondents suggested that they are collaborating with customers (and others) to reduce empty running of their fleets.
The current climate
Ireland’s fleet operators are not immune to global pressures witnessed over the past 6–9 months, from fuel price spikes to supply chain instability. New to our research this year, we asked our respondents the following ‘series of sentiment-based questions’ to gauge the sector’s opinions and reaction to market dynamics beyond their control.
1. The impact of fuel price changes on operating costs
38.4% of respondents suggest that fuel price changes have had a ‘significant’ impact on their operating costs, with a further 46.2% reporting a ‘moderate’ impact.
2. Adjusting pricing or fuel surcharge as a result of changes in fuel prices
15.4% of respondents have changed both pricing and surcharge in response to increasing fuel prices in 2026. 30.0% of respondents have altered only their pricing, with 53.8% electing to alter only their fuel surcharges.
3. Use and management of fuel baselines in contracts
Only 7.7% of respondents do not use a fuel baseline in contracts. 61.5% of respondents regularly review their baselines whilst a further 23.1% will periodically review them.
4. Company approaches to the Road Transport Support Scheme (RTSS)
61.5% of our respondents have applied for and received support under the RTSS. Almost one-quarter of respondents were ‘unsure’ of their approach, attributing this largely to uncertainty, having applied but not yet receiving feedback or pay-outs.
5. In direct response to the crisis in the Middle East…
Lastly, we asked our respondents about the impact of events in the Middle East on their businesses. One-third of respondents (33.0%) have delayed purchasing assets or changed Cap-ex plans as a direct result. One-quarter suggest that investing in alternative fuels or electric vehicles is now a higher priority, whilst a similar share noted that customers (delivery locations) have widened and/or relaxed delivery windows to reduce return journeys in efforts to lower fuel consumption. 15.4% of companies suggested that their staff numbers have fallen as direct consequence of events in the Middle East.
Maintenance costs
The average increase in maintenance costs amongst our respondents increased to 5.6% this year, down from 11.1% last year. 14.2% of respondents reported lower costs, whilst 42.9% of companies reported an increase in maintenance costs of between 1.0%-5.0%. The same share of respondents (42.9%) noted an increase of more than 5.0%, though no companies have seen their maintenance costs rise by more than 10.0% in the last year (compared to 57.1% last year).
For the first time in our report series, this year we sought to identify maintenance cost comparisons for vehicles by fuel type. Whilst, anecdotally, we are able to suggest that monthly maintenance costs for the largest trucks running diesel may be ~70.0% more than their electric counterparts, and those of similar sized BioCNG/CNG trucks are more than diesel, this is not based on a sample size large enough to be definitive. Therefore, we would advise caution when considering this data. It is, however, a data point that we will be revisiting in subsequent editions.
Fuel costs
77.8% of our respondents reported an increase in commercial vehicle fleet fuel costs in the last year, with average annual growth amongst our respondents rising to 5.9%, from 5.2% last year. 22.2% reported a more than 10.0% increase in their fuel costs, up from 18.1% last year. At €0.48, average fuel costs per kilometre across commercial vehicle fleet operations increased from €0.45 last year in line with the €0.49 cost per kilometre recorded in 2024.
These average costs continue to be significantly higher when compared to the consistent findings recorded across our first three reports (2019-2021).
For further context, changes in retail diesel prices are provided in the market data appendix at the end of this report.
Breakdown of costs by vehicle type
Our analysis segments the annual operating costs by types of commercial vehicle, identifying the share of costs allocated to drivers, fuel and insurance. The ‘other’ category covers additional vehicle (and trailer were relevant) costs associated, including maintenance and deprecation.
For rigid vehicles, we see that driver costs account for 43.1% of a vehicle’s operating costs, with fuel making up a further 32.7% of the total, with these figures combining to represent three-quarters (75.8%) of the vehicle’s operating costs.
For 46 Tonnes articulated vehicles, the share of operating costs accounted for by drivers is 32.6%, whilst fuel accounts for a 46.3% share.

__________________________________________________________________________________________________________________
Sustainable finance
Ireland’s Transport and Logistics Sector in 2026: Navigating the fuel crisis, labour shortages and rising fleet costs.
At AIB, we recognise the vital role that the transport and logistics sector plays in supporting Ireland’s economy, connecting supply chains, facilitating trade and ensuring the movement of goods.
From fleet expansion and working capital requirements to investments in technology, sustainability and growth, we work alongside transport and logistics businesses at every stage of their development. Through our nationwide branch network, dedicated relationship managers, sector expertise and specialist Asset Finance team, we provide tailored financial solutions designed to help operators navigate an evolving business environment.
Whether businesses are investing in fleet renewal, warehouse capacity, fuel-efficiency improvements, digitalisation, alternative fuel vehicles or electrification projects, AIB aims to be a trusted long-term partner.
Our focus extends beyond finance, helping customers build stronger, more efficient and future-ready businesses. Ireland’s transport and logistics sector has demonstrated considerable resilience in 2026, continuing to support the movement of goods across domestic and international supply chains despite a challenging operating environment.
A combination of fuel price volatility, geopolitical tensions, driver shortages and increasing fleet replacement costs has created significant pressure on operators, particularly SMEs. Against this backdrop, access to finance, working capital support and strategic investment funding has become increasingly important.
Despite near-term pressures, demand across the transport and logistics sector remains robust. Road freight volumes and kilometres travelled increased during 2025, supported by consumer spending, pharmaceutical exports and construction activity. Ireland’s evolving post-Brexit supply chain model has also boosted demand for warehousing and inventory capacity, helping to underpin activity levels across the sector. The shortage of qualified HGV drivers remains a significant challenge for the sector, increasing wage costs and constraining capacity for many operators.
Encouragingly, initiatives such as FTA Ireland’s apprenticeship programmes and the commercial driving apprenticeship pathway are helping to strengthen the talent pipeline. Research in this report notes that 90% of companies are aware of existing apprenticeship programmes and 45.0% of these companies currently offer these apprenticeship schemes.
The most significant challenge for many transport operators this year has been the sharp increase in fuel costs following renewed geopolitical instability in the Middle East.
Higher diesel prices have had an immediate impact on operating margins, as fuel costs continue to be one of the main costs in the sector. Despite fuel surcharge mechanisms and government supports, operators remain conscious that support schemes are often temporary, whereas elevated fuel prices and geopolitical uncertainty may persist in the longer term.
Electric vehicle adoption has increased gradually in recent years, with better battery performance and vehicle ranges continuing to improve, however charging infrastructure remains too limited to support widespread adoption.
The good news for haulage operators is that the EU has recognised these challenges and introduced support measures in the form of the Electrification Action Plan¹ in July 2026. For hauliers, supportive measures include investment in charging infrastructure, improved grid access, lower electricity costs and targeted support for fleet electrification.
¹ A plan to make Europe the first electro-continent - European Commission
For many operators, the most immediate opportunity may continue to be in urban and regional distribution fleets, where predictable routes, lower mileage and the ability to recharge vehicles overnight at depots make electrification particularly well suited to last-mile and short-haul transport operations.
Alongside electrification, technology will continue to play an important role in helping transport operators manage rising costs and labour shortages. Investment in telematics, route optimisation, fuel management systems and AI-enabled logistics planning can improve asset utilisation, reduce fuel consumption and enhance operational efficiency.
As operators pursue investments in electrification, technology and fleet renewal, access to appropriate funding will remain critical. AIB works closely with transport and logistics businesses to identify investments that improve efficiency, reduce costs and position businesses for future growth. This includes funding for alternative fuel vehicles, depot infrastructure, charging facilities, energy-efficiency measures and wider business investment programmes, often in conjunction with available Government grants and support schemes.
Through our dedicated Asset Finance team, relationship managers and sector specialists, AIB offers a comprehensive suite of solutions including hire purchase, leasing, working capital and sustainable finance facilities. These can help businesses protect cash reserves while investing in newer vehicles, technology upgrades, fleet expansion and other strategic initiatives.
As the sector adapts to rising costs, labour shortages, digitalisation and decarbonisation, AIB remains focused on helping customers invest with confidence and prepare for the opportunities ahead. Combining tailored financing solutions with deep sector expertise, we’re proud to support Ireland’s transport and logistics sector as it builds a more efficient, competitive and sustainable future.
Nessa Devereux, Head of Transport & Logistics, AIB

Finance
In this section of the Manager’s Guide to Distribution Costs we analyse key financial metrics of fleet operations, taking an in-depth look at insurance, cashflow and future plans for capital expenditure, whilst seeking to understand priorities for the leadership and governance of businesses and their management planning processes.
We have expanded our focus on sustainability, to understand not only fleet operators’ motivations and credentials, but also the challenges they face in being ‘green’. Our research identifies the focus of fleet operators’ investments, and if this delivers a return to their businesses, whilst also asking if companies are employing staff to focus solely on ESG.
Truck purchase and leasing costs
Our research once again asked respondents how much money they put aside each month to save towards the purchase of new vehicles for their fleets. Across a diverse range of fleet operators, these amounts will vary enormously by company, not least due to the size of fleet, the type of vehicles operated and a company’s propensity to purchase and / or lease vehicles. Given all of these factors, the average level of monthly savings amongst our respondents was €7,000, some way below the €9,009 average recorded over the five years where we have tracked this metric.
Similar to the investigation of savings for new vehicle purchases above, we also asked respondents to disclose the size of the monthly repayments they make to external finance providers for the lease of their commercial vehicle fleet. Once again, these amounts will vary depending on the size and make-up of a company’s fleet, but respondents revealed that, on average, they are paying €62,686 per month to external finance providers, which is almost 10.0% above average for the five years where we have tracked this metric.
Type of motor insurance
Almost nine-out-of-ten (89.9%) of commercial vehicle fleet operators rely solely on traditional forms of insurance to safeguard their assets. 6.7% of respondents use a combination of self-insurance and traditional fleet insurance.
Timing of insurance renewals
Just over one-half (53.9%) commercial vehicle fleet operators insure their vehicles in the first half of a calendar year, matching our research in the last two years, with 30.8% doing so in the Q3 period.
Motor insurance premiums
Commercial vehicle fleet operators were asked to provide details of their current annual insurance premium, or, if they self-insure, the amount that is set aside for their commercial vehicle fleet. Note that whilst we see costs for heavier trucks being more expensive, costs by vehicle type display fluctuations from year-to-year, which are explained by a different mix of vehicle types and business uses amongst respondents.
Over nine-in-ten respondents (91.0%) reported an increase in their annual insurance premium at the time of their most recent renewal, with 45.5% indicating a rise in premiums of 5.0% or more in the last year.
Some fleet operators, but not all, are taking direct action to reduce their motor insurance premiums. One-third of respondents (down from 46.7% last year) stated their drivers have undertaken safety driving courses in the last year in an effort to lower insurance premiums. Participation in structured safety programmes such as FTA Ireland’s TruckSafe can also cut claims costs and reduce insurance premiums by demonstrating a proactive safety and compliance culture.
Financial and strategic performance
Reflecting the methodology applied across our previous editions, this report again evaluates companies’ cashflow and working capital practices to identify structural patterns and emerging shifts.
This year, we find that 69.2% of respondents believe they fully optimise their working capital, up from 61.5% who gave this reply last year. The remaining respondents (30.8%) admit they only partly achieve this, suggesting that there is still room for improvement across the industry.
Fleet operators face numerous cashflow challenges, including managing delayed payments from customers. From 2023-2025 this issue dominated respondent’s finance departments. This year, we find it is a key concern for one-third of our respondents, whilst the same share (up from 23.1% last year) believe they do not face any significant cashflow challenges. 16.8% of respondents indicate that they face multiple cashflow challenges, including bad debts, creditor/ debtor terms and delayed payments.
In line with our previous research, the ‘turn of the year’ period, from December, through January and into February continues to be the most crucial time of the year for fleet operators managing their cashflow. Two-thirds of companies report this as their most challenging time of the year, with February (33.4%) being the single most challenging month.
The late Summer / early Autumn period, from August to September is also identified, once again, as a difficult period to navigate.
Just under one-quarter of companies (23.1%) are aware that their company makes use of invoice discounting solutions to assist in cashflow management of their business. Each year, respondents to our research are drawn from a variety of job functions, from business owners, to finance professionals, operational and transport staff. Whilst 69.2% of respondents state that their company does not make use of invoice discounting solutions, 7.7% do not know if their company use them.
Recognising the importance of good recruitment
This year’s research confirms that fleet operators undertake staff scenario planning, with all of our respondents indicating this to be the case. One-in-five companies assess staff scenario planning weekly, 46.7% do so monthly and a further one-third do this quarterly.
In addition to staff scenario planning, our research also identified that over three-quarters of respondents (78.6%) undertake succession planning to support the future growth and strategic direction of their businesses.
Recruitment plays an increasingly significant role in business success. 71.4% of respondents (70.6% in 2025) believe that their company’s ability to recruit is impacting the growth of their business, whilst almost over three-quarters (76.9%, up from 64.3% last year) suggest that it is also impacting their day-to-day business operations.
Leadership and governance
Once again, we asked respondents to identify their biggest priority in the year ahead regarding the leadership and governance of their companies. 36.4% of respondents suggested that the provision of training to support business leadership is a priority (down from 45.4% last year), with the same share identifying that resolving skills gaps amongst senior leaders is their biggest priority.
Respondents were once again asked to pinpoint their top leadership and governance priority for the year ahead, and the picture has shifted. Just over one-third (36.4%) now place leadership focused training at the top of their agenda, a drop from last year’s 45.4%. At the same time, an identical share highlights closing skills gaps among senior leaders as their most urgent concern, underscoring growing pressure on business leaders’ performance. The need to overcome challenges in succession planning is an increasing priority for respondents, with 27.2% highlighting this as their key challenge, up from 18.2% last year.
Investing in growth
21.4% of respondents state that they have no plans for capital expenditure in the coming year, a significant increase from the 7.7% that aligned with this sentiment in 2025. This suggests that the challenging market dynamics of the first half of 2026 have promoted changes in strategy amongst fleet operators.
Of those respondents that are undertaking capital expenditure, over one-quarter (27.3%) report that they will manage this from their existing reserves, whilst 36.3% will use a combination of reserves and debt. 27.3% of respondents (up from 16.6% last year) will utilise asset lender debt. On average, the levels of capital expenditure are forecast to be 17.8% higher in the year ahead.
Capital expenditure is likely to be fairly well distributed across a calendar year, though over one-quarter of respondents (27.2%) suggested that July would be the peak month for their spending.
For those companies that are undertaking investment, the main priority in 2026/2027 is fleet, with all of our respondents set to invest in this area. 55.6% of companies participating in our research state that they will be investing in environmental projects, a significant drop from the 80.0% level of 2025.
Three-quarters of respondents will invest in machinery and equipment and 69.2% are set to invest in technology. Similar to last year, around one-half (46.2%) are expecting to invest in the retro-fit, upgrade and refurbishment of existing warehouses or storage facilities while one-third will be investing in new storage facilities.
Sustainable supply chains
It is pleasing to see that 93.3% of respondents say their companies have sustainability policies in place, up from 84.2% last year. This should be placed in the context of the profile of our research respondents, which is weighted towards larger fleet operators.
The main motivation in a company’s efforts to be more sustainable continues to be the need to meet expectations or requirements of customers, suppliers or service providers. This is followed, this year, by a desire to make a positive social and environmental impact.
85.8% of respondents, up from 70.6% last year, state that their company has sustainability credentials (that is certifications, confirming to standards etc).
The financial cost of implementing sustainability initiatives is the biggest barrier companies face in their efforts to be ‘green’, highlighted by 80.0% of respondents. Just under two-thirds (64.3%, down from 73.3% in 2025), state that sustainability initiatives (policies and/or credentials) have assisted in tendering for more work and/or have contributed to contract wins. 35.7% of respondents, down from 42.9%, are aware that their company has already received a grant towards the financial cost of its sustainability initiatives.
Preparing for future change
For the year ahead, investment in EV chargers or other alternative fuel infrastructure, social initiatives and ESG skills and training are high on the agenda for our respondents.
53.8% of our respondents state that their company already has personnel employed solely to focus on ESG and 30.8% expect to recruit people to such roles in the year ahead.
New to our research this year, we asked respondents if their company has assessed climate-related risks to their operations (e.g. flooding, extreme weather, site resilience). One-third state that their company has undertaken partial assessments, whilst a further 8.3% identified that full assessments have been completed. A similar share suggest that assessments have been planned but not yet completed.
Whilst only 8.3% of respondents state that no work has been carried out in this area, almost one-half (41.8%) were unaware if assessments had been undertaken.
For the first time in 2026 we also asked of fleet operators have assessed their future energy needs (e.g. electricity demand, grid capacity, EV transition). Over one-quarter (28.6%) suggested that an assessment has been completed, and actions taken (e.g. ESB application, energy audit) with a further 7.1% stating that an assessment has been completed but no action has yet been taken. One-in-five companies (21.4%) identified that an assessment in progress, whilst 42.9% were unable to confirm whether assessments have been undertaken.
Truck operating analysis
The following section analyses a set of operating metrics for truck operators, by vehicle type including vehicle depreciation, distances travelled (including ‘double running’ where operators achieve this), vehicle ages and life spans, fuel costs and consumption, tyre metrics and maintenance costs and attributes.
2026 Key Operating Metrics
3.5 Tonnes Vans GVW
| Purchase Method (Share purchased outright) | 40% |
| Depreciation Rate | 20.0% |
| Annual Distance (km per Vehicle) | 72,200 |
| Average Age (per Vehicle) (Years) | 3.8 |
| Anticipated Vehicle Life Span (Years) | 6.1 |
| Fuel Consumption (L/100km) | 9.8 |
| Anticipated Tyre Life Span (km) | 40,400 |
| Share of Maintenance Costs on Parts | 25.0% |
On average, 40.0% of vehicles in this category are purchased outright by fleet operators. The average age of vehicles is 3.8 years and expected fuel consumption averages 9.8 litres per 100 kilometres. Approximately 25.0% of a vehicle’s annual maintenance bills is attributable to spare parts.
3.5 - 18.0 Tonnes Rigid Vehicles GVW
| Purchase Method (Share purchased outright) | 57.1% |
| Depreciation Rate | 18.7% |
| Annual Distance (km per Vehicle) | 84,341 |
| Average Age (per Vehicle) (Years) | 5.8 |
| Anticipated Vehicle Life Span (Years) | 8.1 |
| Fuel Consumption (L/100km) | 24.0 |
| Anticipated Tyre Life Span (km) | 37,600 |
| Share of Maintenance Costs on Parts | 42.5% |
On average, 57.1% of vehicles in this category are purchased outright by fleet operators. The average age of vehicles is 5.8 years and expected fuel consumption averages 24.0 litres per 100 kilometres. Approximately 42.5% of a vehicle’s annual maintenance bills is attributable to spare parts.
46.0 Articulated Vehicles (3 axle tractor unit)
| Purchase Method (Share purchased outright) | 32.8% |
| Depreciation Rate | 18.0% |
| Annual Distance (km per Vehicle) | 122,827 |
| Average Age (per Vehicle) (Years) | 4.0 |
| Anticipated Vehicle Life Span (Years) | 6.5 |
| Fuel Consumption (L/100km) | 29.6 |
| Anticipated Tyre Life Span (km) | 106,111 |
| Share of Maintenance Costs on Parts | 41.4% |
On average, 32.8% of vehicles in this category are purchased outright by fleet operators. The average age of vehicles is 4.0 years and expected fuel consumption averages 29.6 litres per 100 kilometres. Approximately 41.4% of a vehicle’s annual maintenance bills is attributable to spare parts.
Comparative analysis by vehicle type
(Download your free report to access charts 18 to 27 / Data tables 61 to 67)
The average age of the fleets identified below should be placed in context of our assertion that a significant share of this year’s research respondents is derived from larger fleet operators. In line with previous editions of the report, we might expect the average age of vehicles to be higher.
For the first time in our report series, we sought to identify the types of tyres used by fleet operators and how, if at all, companies look to increase tyre lifecycles. Despite tyre prices increasing significantly over the last year, almost three-quarters of respondents (72.7%) identified themselves as using mostly premium tyre brands (A/B rated) with 27.3% suggesting they use a mix of premium and mid-range (B/C rated) tyres. Perhaps reflecting the larger average fleet sizes of respondents to our research, no respondents identified themselves as mostly mid-range (C rated) or primarily budget tyre options.
When it comes to increasing the number of tyre lifecycles through re-treaded or re-grooved tyres (e.g. Remix/Remould), 18.2% of respondents stated that they use such practices widely across their fleet, with the same share suggesting they have limited use.
No companies are currently trialling or considering such approaches and almost two-thirds (63.6%) stated they do not employ such practices in their operations. This does not come as too much of a surprise as the price of ‘budget ‘tyres has reduced so much that the value / price gap is too close.
Tyre landscape overview
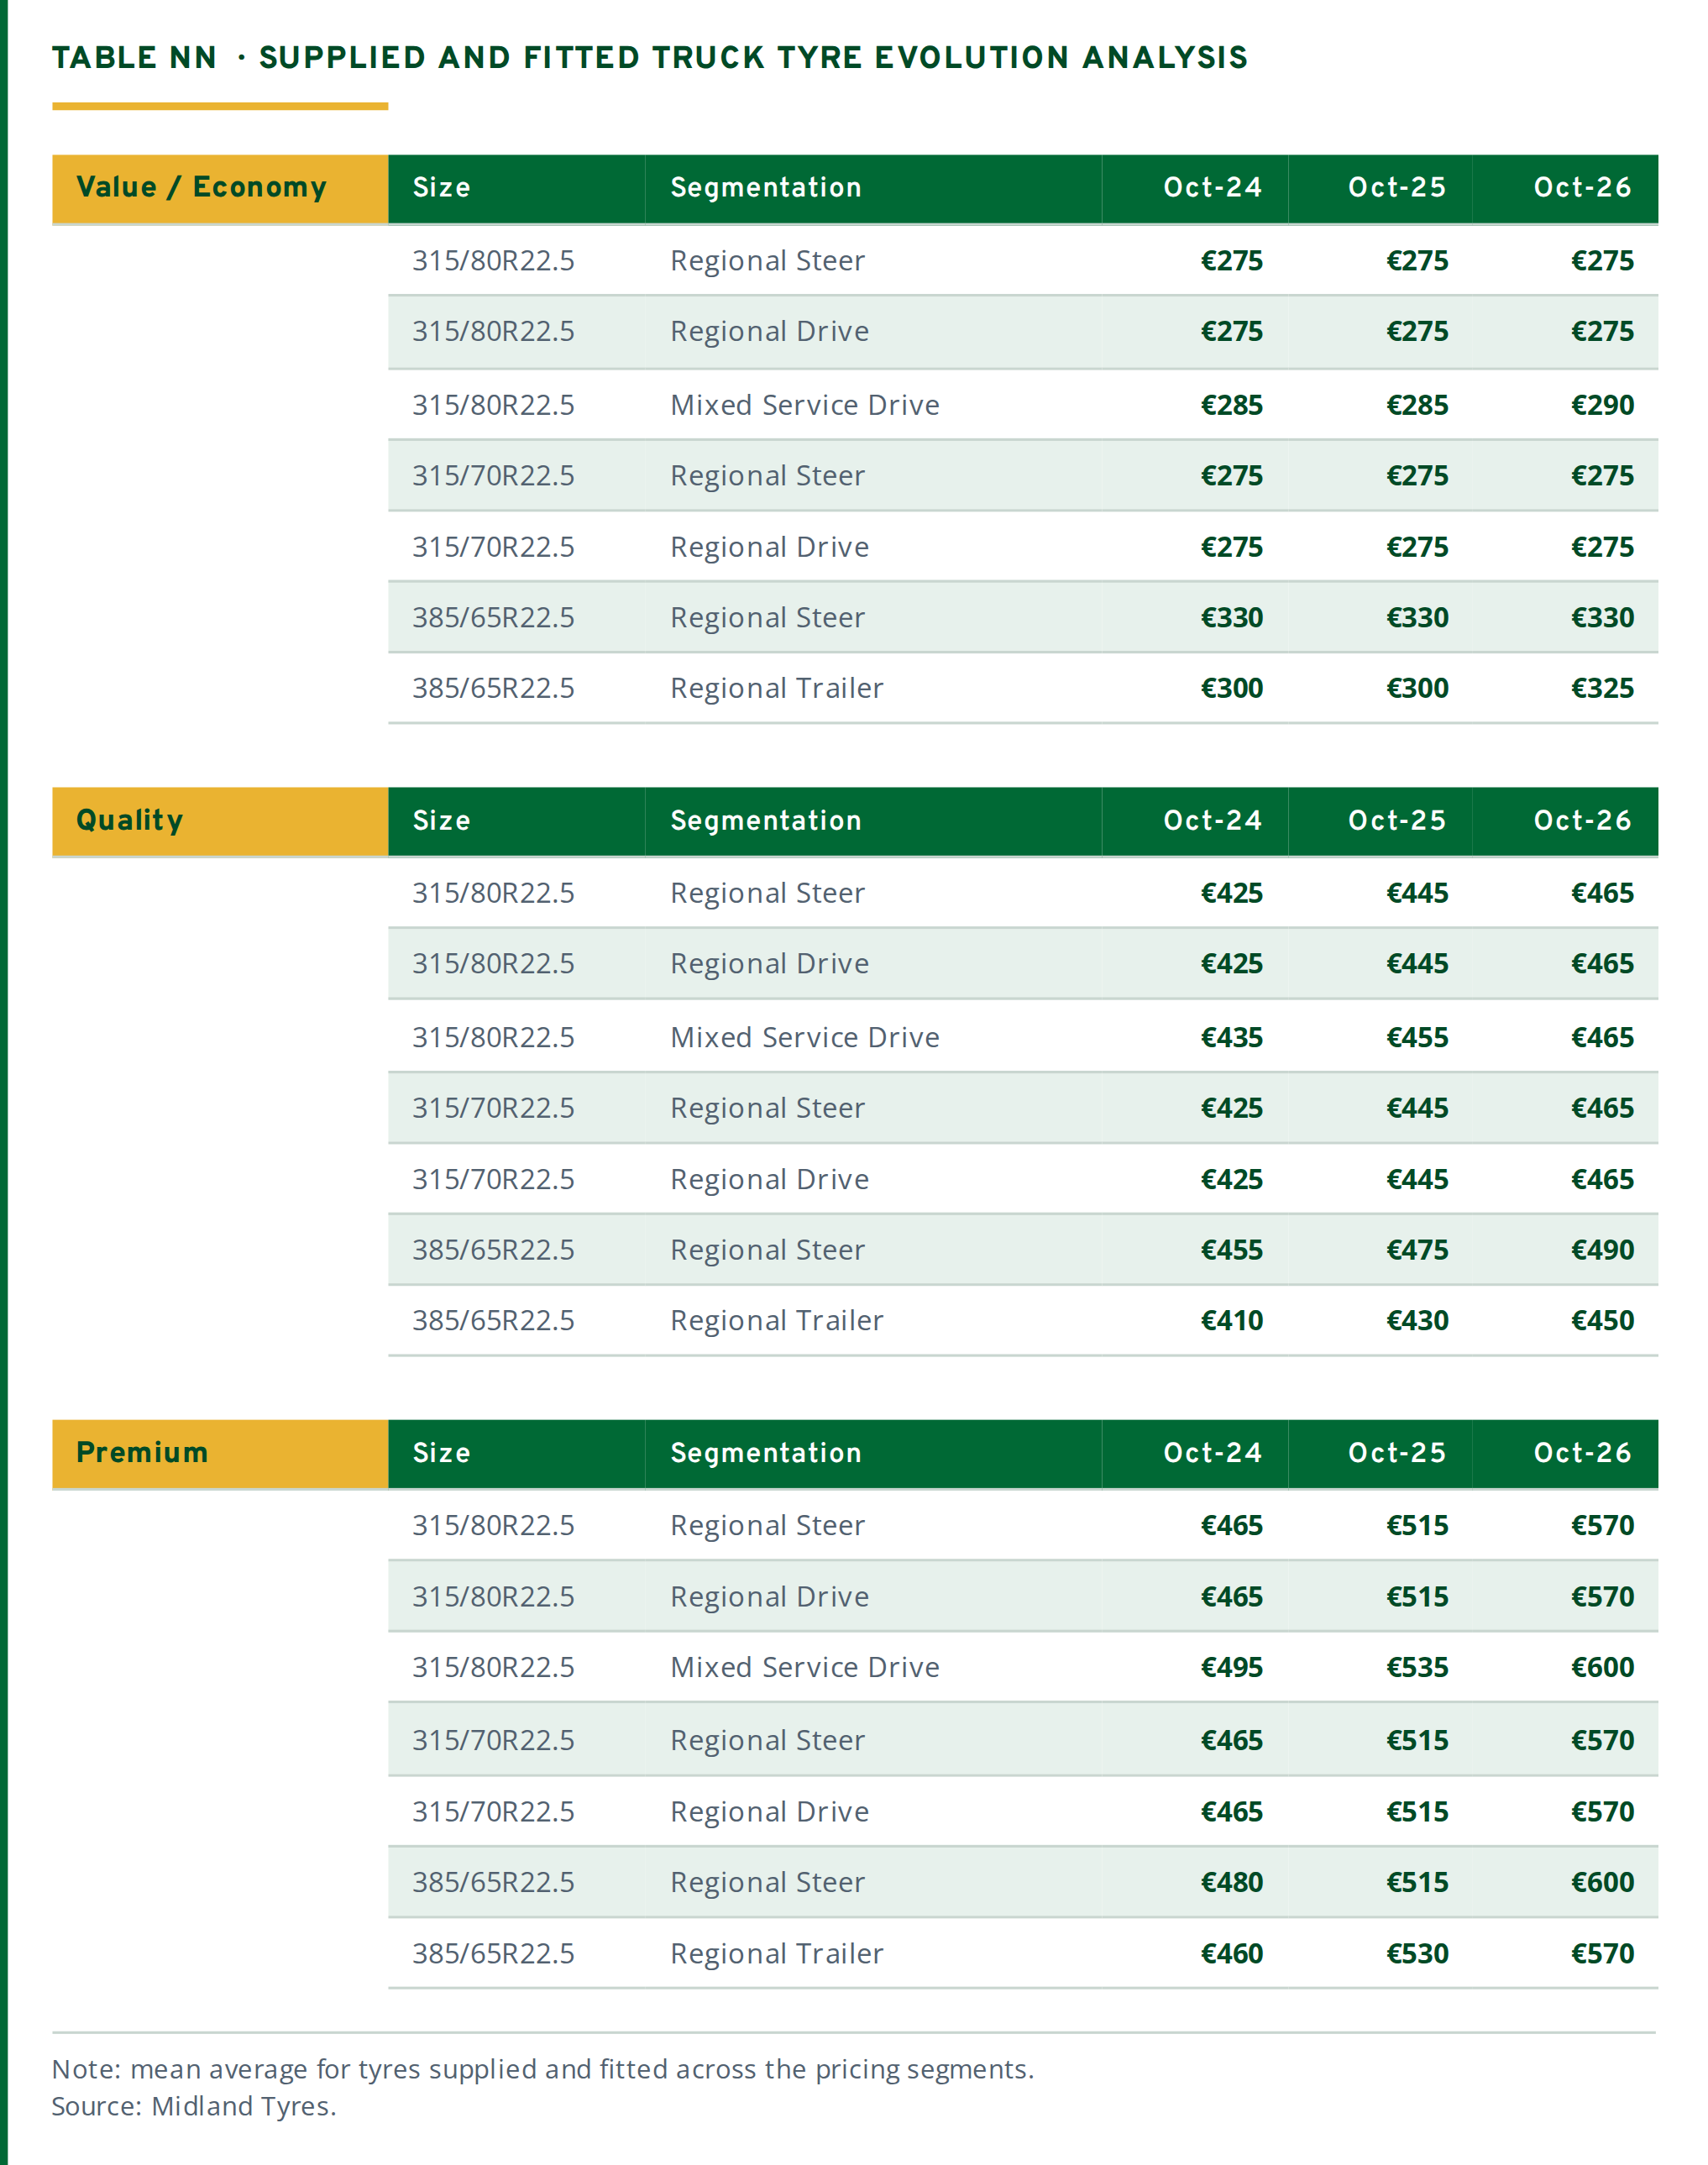
Tyres matter to truck fleet operators because they directly influence safety, compliance, cost, and vehicle performance. Analytiqa sat down with Trevor Burns, Strategic Manager at Midland Tyre Services, for a discussion on the latest developments in truck tyres and the outlook for the year ahead...
In a costs focused report, there is only one place to start. How will fleet operators in Ireland have seen tyre prices change over the last year?
“The last 12 months has seen the Irish truck tyre landscape continue to come under steady upward pressure in terms of pricing. However, depending on the brand position there has been notable latency in some of these effects as geopolitical events have affected some brands differently.”
How would you describe the current pricing dynamics across premium and economy segments?
“Premium truck tyres manufactured typically in Europe and Japan have seen consistent and incremental increases as rising energy, labour and logistics costs combine to create continually difficult conditions for manufacturers. These trading conditions allied with a general reduction in premium truck tyre manufacturing capacity, whilst the OEM market simultaneously recovers and demand increases, as well as a shift towards highly differentiated products has resulted in a series of single digit price increases from most manufacturers.
At the value / economy brand position, the effects of international trade tariffs and the introduction of the UK’s revised anti-dumping and countervailing measures for truck tyres resulted in a somewhat more depressed market as some manufacturers in this segment struggled to deal with an oversupply of tyres with a much smaller market willing to accept these tyre types.
The resultant ‘dumping’ of lower price / quality tyres has seen a much more subdued level of increase. However, as the inventory levels and access to new markets of these manufacturers has normalised somewhat, the speed and severity of the effects of factors such as raw material price increases, foreign exchange impacts and importantly shipping and logistics costs means that there are significant price increases likely over the next three to six months with indications of multiple double-digit impacts likely.”
What does this mean for fleet operators?
“The impact of these price increases means that users should be really focused on total cost of ownership across the entire operating life cycle of their tyres. This moves the focus beyond the typical Price Per Kilometre life analysis, as existential factors such as damage resistance, end of life casing value, extended life potential and retreadability have real impacts on operational costs.”
Beyond price, what’s changing with tyres?
“The move away from general application truck tyres to that of application specific tyres continues to evolve. Even economy tyre manufacturers are now expected to have a viable low rolling resistance tyre offer and we have seen this trend accelerate over the last 12 months. However, the scale and cost of R&D and raw materials required to achieve competitiveness in this arena are still evident with ‘A’ and ‘B’ rated rolling resistance tyres still largely the preserve of the premium manufacturers. The performance gap measured in the singular lens of tyre life and price (PPK), between premium and value segment brands had narrowed significantly over recent years.
Our fleet data on tyre wear performance demonstrates that a well specified tyre choice for the use application, matched with a good husbandry regime can now come very close or even match premium rivals when measured through in this context alone. This evolution has driven premium manufacturers to develop evermore differentiated products that perform not only on a ‘life’ basis but also across other multiple metrics such as:
- low rolling resistance coefficients
- high mileage life
- lower tyre weights
- EV compatibility
- sustainable components
- connectivity
- retreadability
- serviceability.
In focusing on these aspects, premium manufacturers are seeking to move tyres away from being a consumable component of a truck; to being an integral part of a fleet’s data, efficiency and sustainability ecosystem. Despite EU policy continuously bringing aspects such as tyre abrasion, tyre life and retreadbility into scope, at present, our experience is that Irish users are still very focused on PPK metrics alone and are not so engaged with other existential aspects just yet.”
Can you outline how tyre performance influences overall vehicle efficiency?
“It’s a long-established fact that tyres are responsible for up to 30.0% (source: Michelin) of vehicle energy consumption. This means that a diesel-powered vehicle with a fuel consumption of 33L/100km (8.6mpg) that covers 100,00kms in a year, it uses up to 9,900 litres (€15,800) of fuel just to activate the tyres!
With this in mind, it’s clear that there is both a financial and sustainability opportunity to address this area of operation. The advent of alternative fuel vehicles has amplified this need as 30.0% availability of energy has the ability to move vehicles in or out of the utilisation window for most fleets.”
How should fleets evaluate the trade offs between tyre cost, tyre life, and fuel saving?
“Of course, tyres alone are only one piece of the puzzle in reducing fuel consumption, but they are an important one and perhaps the easiest to affect for fleets. In the past, tyre manufactures have responded to the requirement to lower rolling resistance from regulators, users and vehicle manufacturers alike by developing tyres with unique rubber compounds often containing high levels of silica infused rubber combined with efficient casing design and importantly to users, lower tread depths. In service, these tyres tended to perform really well in certain narrow scope applications but for regular ‘regional’ type use it often proved difficult for users to realise any potential benefit.
This affect would be exacerbated where operational costs were managed departmentally; for example, despite spending slightly more on tyres but saving significantly on fuel, often we witness a less efficient tyre but longer lasting tyre in use as the maintenance budget did not benefit from any fuel savings! Over the last number of years, premium manufacturers have continuously developed their offers in the lower rolling resistance segments. Many now have products that offer really good fuel saving opportunities balanced with good life potentials (more tread depth, wear resistance etc) making the transition to a ‘fuel efficient tyre’ easier for fleets.
Despite this, for fleets looking to impact their fuel use through the application of energy efficient tyres, the essential first step remains to utilise a balance score card assessment approach that captures and accounts for all the operational effects, tyre life, fuel use, reliability, cost, end of life etc.”
What are the main tyre related compliance challenges facing Irish fleets today, and how can operators improve roadworthiness and performance?
“The RSA continues to report that tyre related issues account for more than 20.0% of road worthiness compliance issues detected at roadside. Tyres are the point where a vehicle and road surfaces contact each other and poorly maintained tyres and wheels can negatively impact braking, grip, steering or stability performance, all of which can be exacerbated with the effects of the very changeable Irish weather. The increasing costs of labour, equipment and maintenance within the transport sector means that there is an increased need to extract value from consumable components such as tyres whilst there is also a requirement to improve vehicle utilisation and uptime. This coupled with constrained access to suitably trained and empowered driver’s, technicians and service teams means that it is becoming more and more difficult to manage tyre and wheel compliance and performance. As a service provider to the industry, we regularly now encounter fleet tyre removals taking place when up to 30.0% (first life) life performance is remaining, simply because the vehicle may not be adequately inspected and recorded before the tyre become uncompliant in terms of remaining tread depth or condition.
Without doubt, the introduction of AI powered tyre tread and pressure readers, coupled with TPMS and smart tyres will improve efficiencies in this regard, but educating drivers and maintenance partners of what is and is not compliant is an important step in improving road worthiness compliance. Programmes such as the FTAI Truck Safe Standard are an excellent way of raising standards across the sector.”
Trevor Burns, Strategic Manager, Midland Tyre Services

__________________________________________________________________________________________________________________
__________________________________________________________________________________________________________________
Procurement, energy & eco training
Progress, but at different speeds
The 2026 survey shows continued progress in fleet renewal, alternative fuel adoption, data use and driver training. Average vehicle age fell across vans, rigid and articulated vehicles; annual utilisation was broadly similar to 2025.
The share of companies running at least some alternatively fuelled vehicles rose from 52.9% to 60.0%, satisfaction among users from 4.8 to 7.5 out of 10, and reported savings from alternative fuels averaged 5.7%, against 3.0% in 2025.
Expectations are more cautious: 57.1% of operators not yet using alternatively fuelled vehicles have no confirmed investment timescale. On the fleet data supplied, respondents expect their alternatively fuelled fleets to be 44.3% larger by end-2030 — a different measure from 2025, so not a direct year-on-year comparison.
Infrastructure remains a constraint
Infrastructure concerns eased but remain significant: 81.8% of respondents cited uncertainty over the availability and accessibility of high-speed charging for heavy-duty vehicles, 83.3% poor visibility of hydrogen refuelling locations, and 54.5% limited access to, or information about, the electricity grid.
Vehicle capability, purchase cost, charging infrastructure, battery life and residual values also remain concerns, so transition requires early assessment of routes, duty cycles, depot energy needs and total cost of ownership.
Making better use of fleet data
All respondents now use telematics and vehicle tracking. More than nine in ten report fleet performance regularly to senior management, 91.7% use fuel data for staff and driver training, and fleet data also informs procurement and sustainability reporting.
But fragmented systems, spreadsheets, manual inputs and integration difficulties persist: some fleets collect substantial data without a consolidated view of utilisation, route efficiency, fuel use and driver performance. Use of artificial intelligence in fleet optimisation was broadly unchanged at 23.1%.
EcoDriving delivers measurable savings
EcoDriving is among the most practical ways to improve efficiency without replacing vehicles or waiting for new infrastructure. An average of 74.4% of commercial vehicle drivers have received EcoDriving or similar fuel-efficiency training — up from 68.0% in 2025 and the highest in six years — and operators reported average savings of EUR 39,625 over the previous 12 months.
It works best with clear performance measures, constructive coaching and refresher sessions. Incentives are spreading: 38.5% of operators now offer financial rewards, against 18.8% in 2025, averaging €488 per driver a year. Comparisons must account for vehicle specification, payload, route conditions, congestion and operational requirements; drivers engage more when measures are transparent, achievable and recognise improvement.
Maintaining momentum
Change is gradual rather than uniform. The immediate opportunity is to use existing information more systematically, set reliable baselines and focus on a small number of meaningful measures. Alternative fuels and zero-emission vehicles will be central to longer-term decarbonisation, but uptake depends on suitable vehicles, infrastructure and a viable business case.
________________________________________________________________________________________________________________
"Better use of data and sustained EcoDriving improvement can reduce fuel use, operating costs and emissions now, while preparing fleets for a more diverse, technology-led future."
Conor Molloy, MSc (Energy), CEM-I, CMVP, Registered Energy Auditor, ECOfleet

________________________________________________________________________________________________________________
Vehicle procurement
Over one-half (53.8%) of commercial vehicle operators in Ireland pass responsibility for the acquisition of vehicles to a leasing company, whilst 30.8% issue RFQs, or tenders, based on price. The remaining 15.4% of operators are issuing RFQs, or tenders, based on the anticipated life cycle costs of their vehicles.
For the second time in our report series, this year we once again asked respondents to rate the importance of vehicle price in their truck purchasing decision making. We asked respondents to provide a score from 0 to 10, where 0 indicates where prices have no bearing on investment decisions and a score of 10 reflects that prices are the most important factor in investment decisions.
The average score awarded by respondents was 7.4, down just marginally from 7.7 in 2025. It was interesting to note that 85.8% of respondents provided a score of six or greater (up slightly from 83.3% last year).
Alternative fuels
The uptake of alternatively fuelled vehicles continues to increase and our research confirms fleet operators’ significant interest in decarbonising their fleets moving forwards.
Once again, we asked respondents the extent to which they had already embraced the use of alternatively fuelled vehicles in their commercial vehicle fleets. This year 60.0% of respondents (up from 52.9% last year) claimed that they were operating alternatively fuelled vehicles, a significant rise from 33.4% that reported this in 2024.
Whilst larger fleet operators, in particular, may have either already undertaken their initial research and / or actively already invested alternatively fuelled vehicles, one-third of our respondents indicated that they are currently exploring battery / electric vehicles for their fleet operations. One-fifth of respondents are exploring the use of hybrid electric vehicle options whilst 33.3% are investigating bioCNG/CNG vehicle types.
We also asked respondents that are not currently operating alternatively fuelled vehicles, when they expect to do so.
Our research this indicates greater uncertainty over timelines amongst our respondents, with 57.1% (up from 37.5% last year) stating that they have no confirmed timescales to invest. 14.3% suggest that investment in alternatively fuelled vehicles is imminent in the short term, with a similar share stating that it would be in the next two years (2027-2028) or alternatively, the 2029-2030 period.
Based on the fleet operating data provided in the research process, this would indicate that, in comparison to the start of 2026, our respondent’s alternatively fuelled vehicle fleets will be 12.1% larger by the end of the year, 27.0% larger by the end of 2028 and 44.3% larger by the end of 2030.
Further data on the use of alternative fuelled vehicles in Ireland is provided in the market data appendix.
In response to the increasing use of alternatively fuelled vehicles, we asked respondents to provide a high-level ‘satisfaction score’ to describe their experiences. Rating scores from 0 - 10, where 0 reflects the lowest and 10 the highest levels of satisfaction, or respondents delivered a score of 7.5 on average, up significantly from 4.8 last year, with all respondents providing a score of six or above.
To understand fleet operators concerns about transitioning to alternatively fuelled vehicles, over one-half (54.5%, down from 69.2% last year) stated that they have limited access to, or insufficient information about, the electricity grid. 81.8% (down from 92.3% last year) suggested that they have uncertainty about the availability and accessibility of high-speed chargers for heavy-duty vehicles, whilst 83.3% (down from 90.9%) attributed the delays in their commitment to a lack of visibility regarding the locations of refuelling stations.
Other notable concerns, or barriers, to making investments continue to include the operational functionality of vehicles, the costs involved, not only of vehicles but also that of charging infrastructure, dependable assurances about battery life, and also the resale value of trucks.
Reporting and monitoring fuel consumption
When asked to identify the cost savings that our fleet operator respondents are making from the use of alternative-fuelled vehicles. For those of our respondents using alternative energies, across all fuel types, the average cost saving was 5.7% this year, up significantly from 3.0% last year – and the biggest cost saving metric we have recorded in six years, likely reflecting the diesel price hikes witnessed this year.
In their attempts to save money on fuel one-half of respondents (50.0%) have fuel escalators and/or premium pricing for reduced CO2 / electric / HVO fuelled journeys, as part of their operations and commercial relationships).
These are transparent methods of dealing with fluctuating fuel prices, as a surcharge both increases and decreases in line with the actual fuel prices paid. 75.0% of our respondents that are using fuel escalators stated that they review these on a monthly basis, whilst over one-half (54.5%) of all respondents stated that they are using the Diesel Rebate Scheme.
63.6% of our research respondents indicate that fuel cards are used to monitor fuel consumption for commercial vehicle fleets. 27.3% of companies use a combination of approaches to report fuel use, across fuel cards and telematics systems, whilst 9.1% use other, bespoke systems, largely defined as ‘manual’ reporting, based upon driver feedback, logging / data recording and also charge point monitoring of EVs.
The challenges that research respondents see in collecting, reporting and analysing fuel data are numerous, and continue to remain consistent with previous feedback. Challenges noted by respondents include:
- Technological challenges, including lack of 4G network signal and impact of power outages
- Achieving a consolidated view of vehicle utilisation, driver performance, and route efficiency in real time
- Monitoring compliance is reactive rather than proactive due to limited data visibility and alert systems
- Limited intelligence where routing is based on static schedules, not real-time traffic or load balancing
- Data accuracy and integration across platforms
- Efficient utilisation of resources. Reporting processes are time-consuming and reliant on manual inputs
- Ad hoc nature of order patterns from customers
- Fleet managers that still use spreadsheets and periodic downloads instead of live dashboards
How is this fuel data used?
Maintaining the exceptionally high responses that we have recorded over the last three years, once again more than nine-out-of-ten companies use fleet data to report performance to senior management on a regular (weekly/monthly basis), whilst an eight year high of 91.7% of respondents also use the data to assist in the training of staff and drivers. 84.6% of fleet operators use fleet data in the procurement of new vehicles and a similar share use such the data to promote their company’s ‘green’ credentials and sustainability efforts.
Transport management and planning
This year, and for the second successive year in our report series, all of our research respondents stated that their companies use vehicle telematics or tracking to plan and control their commercial vehicle fleets. Whilst this continues to reflect a greater uptake of telematics and tracking across the industry, it is also remembered that our report’s respondents are weighted towards the country’s larger fleet operators. Building on last year’s introduction, we again asked if companies are using Artificial Intelligence (AI) tools in their fleet optimisation. Just under one-quarter (23.1%) of respondents stated that they are utilising AI for this purpose (in line with the 23.5% last year).
Company transport management and planning costs
Average annual costs related to transport management were, for the first time in our report series, in excess of €45,000 per company, a big jump from 2025. This equates to an average of €764 per vehicle across all vehicle categories, with the lower number this year reflecting the higher average fleet sizes of our respondents. Transport management and planning costs are defined as the total financial cost for tools used by operators to plan, control and monitor their commercial vehicle fleet. This includes costs of initial system purchase and / or ongoing fees. If an in-house developed system is used, we identified the financial costs allocated to the system’s upkeep, maintenance and development
Action and incentives to save fuel
Amongst the companies taking part in our research this year, on average, 74.4% of commercial vehicle drivers have received ‘Ecodrive’ training, or similar – the highest share in the six years that we have tracked this metric. Across the six-year period we see an average take up of such training at 65.8%.
Likely encouraged by the work undertaken by FTA Ireland, almost three-quarters of our respondents (72.7%) are aware of and/or have used standard/certified schemes for driver ‘Ecodrive’ training. Whilst anecdotal insight suggests low take up of the standard, the significantly higher figure generated by our research is likely attributable to the larger share of FTA Ireland members participating, who will be more aware of the work that FTA Ireland undertake in this area. Respondents suggested that their average cost savings from use of ‘Ecodrive’. or similar, training has been €39,625 over the last 12 months. 53.8% of commercial vehicle fleet operators do not offer their staff incentives to save fuel.
Amongst those operators that do offer fuel saving incentives, there is a mix of approaches on how best to achieve this across both non-monetary and purely financial-based incentives. Amongst those operators offering financial incentives, on average €488 is spent per year, per driver, to encourage more efficient use of fuel. Recognising the increasing importance of fuel saving efforts, companies are willing to spend more to encourage their drivers to act.
Decarbonising Ireland’s freight & logistics
Progress is becoming visible
Ireland’s freight and logistics sector is moving from broad decarbonisation ambition towards practical delivery. The 2026 Manager’s Guide to Distribution Costs shows that lower-emission technologies are increasingly influencing fleet decisions, infrastructure investment, tendering and workforce planning. Progress is evident, but the pace of transition still depends on cost, infrastructure availability and confidence that emerging technologies can meet demanding duty cycles without weakening supply-chain resilience.
Sixty per cent of respondents now operate alternatively fuelled vehicles. One-third are actively exploring battery-electric vehicles, while a similar proportion are considering BioCNG or CNG. Operators expect the alternatively fuelled share of their fleets to increase by 12.1% by the end of 2026, 27.0% by 2028 and 44.3% by 2030. Satisfaction has risen from 4.8 to 7.5 out of ten, indicating improving vehicle capability and operational experience.
These results must be interpreted carefully. Urban delivery, regional distribution, passenger transport, construction and long-haul freight have different energy, payload and range requirements. There is no single solution. A technology-inclusive transition, based on real operations, emissions performance and whole-life cost, remains essential.
A whole-system pathway
The ZEVI HDV Electrification Pathway provides a timely national framework. It notes that heavy-duty vehicles represent only 5.0% of Ireland’s road fleet but contribute more than 20.0% of road transport emissions. It identifies high capital costs, limited public charging, vehicle availability and workforce readiness as key barriers, and calls for a whole-system approach integrating vehicles, charging infrastructure, energy networks, funding, regulation and skills.
The Pathway recommends beginning with predictable, return-to-base operations such as urban transit, regional delivery, refuse collection and elements of construction. Depot-first charging can offer greater control and lower cost, while long-haul operations will increasingly require strategically located high-power and megawatt charging. Fleet and site assessments, multiannual vehicle and infrastructure grants, streamlined planning and real-world demonstrator programmes are needed to convert policy ambition into investable projects.
Learning from demanding operations
The Decarbonising Forestry - Log Haulage in Ireland 2026 report, developed by FTA Ireland with Coillte and Analytiqa, reinforces the importance of sector-specific evidence. Log haulage combines heavy payloads, rural collection points, variable terrain, seasonal conditions and demanding delivery schedules. It is therefore a valuable test of vehicle capability, route planning, charging or refuelling strategy and operational resilience.
The report establishes an operational baseline and a practical roadmap covering HVO, electrification, biomethane, hydrogen and efficiency measures. Its central lesson is that transition pathways must reflect actual user profiles rather than theoretical averages. Trials, including the development of an electric concept vehicle for log haulage, can build evidence, identify infrastructure requirements and reduce investment risk. The learning should be shared across freight sectors so that successful approaches can be adapted and scaled.
The role of HVO and renewable fuels
The Department of Transport’s Hierarchy of Use of HVO report adds an important perspective. HVO can provide immediate lifecycle emissions reductions as a drop-in replacement within much of the existing diesel fleet, but sustainable feedstocks are limited and Ireland remains dependent on imported fuel and raw materials.
...from ambition to delivery
HVO should therefore be treated as a strategic transitional resource and directed towards operations where electrification or other zero-emission options are not yet practical.
This supports FTA Ireland’s position that certified sustainable HVO, biomethane and BioCNG should complement, not delay, electrification. Clear sustainability criteria, traceability, supply diversity and price transparency will be essential. Renewable fuels can reduce emissions from existing vehicles and harder-to-electrify duties while zero-emission vehicle availability and supporting infrastructure develop.
Investment confidence and commercial delivery
The transition must also make commercial sense. The 2026 research finds that 64.3% of respondents expect to invest in EV charging or alternative-fuel infrastructure, while 61.5% plan to invest in ESG skills and training. However, 80.0% identify financial cost as the largest barrier, and 54.5% report limited access to, or information about, electricity-grid capacity.
FTA Ireland’s Pre-Budget Submission 2027 calls for multiannual funding certainty and a Commercial Transport Energy Rebate that recognises electricity, HVO, BioCNG, biomethane and hydrogen alongside qualifying diesel during the transition. Support must extend beyond vehicle grants to fleet assessments, depot upgrades, faster grid connections, public charging and dependable refuelling infrastructure. It must also be accessible to smaller and regional operators, which have less capacity to absorb capital costs, downtime and residual-value risk.
Sustainability is increasingly a commercial capability. Some 93.3% of respondents have a sustainability policy, 85.8% hold sustainability credentials or certifications, and 64.3% report that sustainability initiatives have supported tenders or contract wins. Customers increasingly expect measurable evidence of environmental performance across their supply chains.
From ambition to implementation
The next phase must connect ambition with delivery. Government, operators, customers, vehicle manufacturers, energy providers, ports, local authorities and training bodies need to coordinate investment around real freight movements and operational needs. Through the FTA Ireland Alternative Fuels Working Group, evidence can be shared, barriers addressed and workable solutions tested.
The direction is positive, but transition will not accelerate on intent alone. A practical, phased and technology-inclusive approach can reduce emissions while protecting the reliability, affordability and competitiveness of the supply chains on which Ireland’s economy and communities depend.
__________________________________________________________________________________________________________________
__________________________________________________________________________________________________________________
Employment, wages & training
Drivers’ employment status, conditions and nationality
Across commercial vehicle fleet operators in Ireland, almost nine-out-of-ten drivers (88.6%) are employed on a full-time basis. 3.4% are sub-contractors. Seasonal staff account for a further 5.3% of commercial vehicle drivers. December continues to be the month highlighted by respondents as the peak time of the year when companies expect to employ the highest number of drivers (company or agency staff) across their commercial vehicle fleets.
For the fifth year, we once again asked respondents to segment their drivers by gender, and age, highlighting that 1.7% of drivers at this year’s respondents are female, marginally below the 2.1% average figure recorded over the 2022-2026 period. Just 4.5% of drivers are aged 30, or younger, with 15.4% aged between 31 and 40, meaning that less than one-in-five drivers are aged 40 or younger. 32.6% of drivers are aged between 41 and 50, whilst 47.5% are 51 and above, with 14.7% being 60 or older.
The average commercial vehicle driver salary across all vehicle types, increased 5.5% in the last year, with 50.0% of companies reporting that they have increased driver salaries in the last 12 months. Reflecting intense cost pressure across the sector in 2026, this is down significantly from the 82.9% that implemented increases in 2025.
A more detailed analysis, illustrating higher growth rates for specific vehicle types, is illustrated in the data tables at the rear of this report.
On average, across all vehicle types, commercial vehicle drivers are entitled to almost 21 days’ holiday per year (20.7). Two-thirds (66.7%) of commercial vehicle fleet operators offer drivers 20 days’ holiday per year. Almost two-thirds (64.4%) of drivers of commercial vehicles in Ireland are born in the country. Across the eight years of our report, respondents have provided a consistent response to this data-point, on average indicating that 64.0% of drivers were born in the country.
Amongst the other nationalities of drivers, our research once again indicates that a significant number of drivers hail from Eastern Europe, including Poland, Romania, Lithuania, Latvia, Bulgaria, Croatia, Estonia and Slovakia.
A number of drivers also hail from countries and regions, in Europe, and beyond, including Northern Ireland, Great Britain, Portugal, South Africa and Zimbabwe. Over one-quarter of our research respondents (28.6%) have applied for work permits to employ non-EU drivers.
Drivers’ employment conditions by vehicle type
Reflecting recruitment challenges, gross weekly wages for van drivers increased by an average 10.4% in the last year, according to our respondents, significantly higher than the average 3.4% increase seen last year. For drivers of rigid commercial vehicles, gross wages increased marginally in both 2023 and 2024 but were 6.4% higher in 2025 and 4.8% higher in 2026. For drivers of articulated vehicles, gross weekly wages increased 8.2% this year, up significantly from the 2.4% increase recorded last year.
Transport staff
98.9% of transport staff at commercial vehicle fleet operators, defined as transport managers and transport planners, are employed on a full-time basis.
For the fifth time in our research series, we asked respondents to segment their transport planning and management staff by gender. 29.5% of such employees are female (down from 31.2% last year). Across the five years of compiling this data point, the average share of transport planning and management staff that are female is just under one-third (32.8%). The salary figure identified below is calculated as an average across all levels of seniority of staff.
Average transport staff basic salaries were €63,626 this year, an increase of 4.1%, and consistent with the 4.3% increase recorded last year.
81.5% of transport staff at commercial vehicle operators in Ireland were born in the country. Across the eight years of our report this datapoint has been consistent, averaging 84.1% across the 2019-2026 period.
Transport staff employment conditions by role
Respondents were asked to provide employment details of people allocated to the roles of Transport Managers and Transport Planners. They were asked to exclude any agency employees and avoid the double-counting of staff that may perform more than one role.
Transport Manager’s basic weekly wages increased 2.5% this year across our respondents, up from a 1.3% increase awarded last year. Basic weekly wages for Transport Planners amongst our respondents increased 8.5% this year, up from a 2.7% increase awarded last year.
Transport operations & commercial driving apprenticeships
A workforce challenge that requires long-term action
Ireland’s freight and logistics sector depends on a skilled, professional and reliable commercial driver workforce. However, recruitment and retention difficulties are now a structural challenge, affecting operating costs, service reliability, supply-chain resilience and business growth.
The 2026 Manager’s Guide to Distribution Costs research highlights the scale of the pressure. Some 71.4% of respondents believe recruitment difficulties are affecting business growth, while 76.9% report an impact on day-to-day operations. Drivers account for 75.7% of reported vacancies, and it takes an average of 30.7 working days to fill a driver vacancy. Participating businesses estimate that skills shortages cost them an average of €16,667 each year.
The age profile adds urgency. Only 4.5% of drivers employed by respondents are aged 30 or younger, while 47.5% are aged 51 or over, including 14.7% aged at least 60. Women account for just 1.7% of drivers. Although the research is weighted towards larger operators and should not be interpreted as representing the entire sector, the findings point to a limited pipeline of younger entrants and the need to attract people from a broader range of backgrounds.
A recognised route into the profession
The Transport Operations and Commercial Driving Apprenticeship provides a practical response. Developed by FTA Ireland in collaboration with Atlantic Technological University Sligo, the programme was launched in May 2022 and welcomed its first apprentices that September. ATU Sligo is the coordinating provider and remains an essential academic partner, supporting programme delivery, learner development, academic quality and continued alignment with industry needs.
Successful apprentices receive a Level 6 Higher Certificate in Transport Services and Commercial Driving, the first qualification on Ireland’s National Framework of Qualifications directly linked to the commercial driving profession. The two-year blended programme combines one day of online or in class (hybrid) academic learning each week with four days of structured workplace experience, allowing apprentices to participate from locations across Ireland.
The curriculum reflects the wider responsibilities of today’s professional driver. It covers professional driving, supply-chain management, HGV technology and roadworthiness, customer care, warehousing and distribution, finance, route planning, customs and international trade, transport law, workplace and vehicle safety, management and enterprise development. This supports the safety, compliance, customer service, digital and operational capabilities required in a modern fleet.
Combining education, licensing and workplace experience
A central strength of the apprenticeship is the integration of academic study with the commercial driving-licence pathway. From the outset, apprentices begin working towards a Category C licence by completing the theory test, medical assessment and learner-permit requirements. On-road instruction begins during Year 1 through approved driving centres and RSA-registered private training providers.
The planned pathway sees apprentices progress towards the Category C driving test in March or April of Year 1, begin Category CE lessons around August after Year 1, and undertake the Category CE test in October of Year 2. Higher Education Authority funding supports the cost of driving instruction. This integrated structure reduces significant financial and practical barriers while giving employers confidence that apprentices receive consistent development in driving, safety, compliance and transport operations.
From employer interest to successful participation
The 2026 research shows a strong base on which to build. Some 90.9% of participating companies are aware of logistics apprenticeship programmes, 72.7% are interested in facilitating apprenticeships to support recruitment, retention and talent development, and 81.8% are aware of available Government funding. However, only 45.5% currently include apprenticeships in their workforce strategy.
...building Ireland’s future commercial driver workforce
The priority is therefore to convert awareness and interest into active participation Employers planning for the September intake should begin as early as April.
The Apprentice Coordinator can help promote vacancies through the programme website, social media, CareersPortal.ie and targeted mailing lists. Employers remain responsible for receiving applications, screening candidates and selecting the person best suited to the role and the business.
Registration process for employers
- Express an interest by contacting the Apprentice Coordinator or completing the employer expression-of-interest process through Apprenticeship Online.
- Meet the Apprentice Coordinator, online or in person, and complete the employer preparation presentation so that the organisation fully understands the programme commitments.
- Following approval by the Apprentice Coordinator, arrange a visit from the local Education and Training Board’s SOLAS Authorising Officer.
- Nominate an appropriate workplace mentor and training adviser.
- Recruit, screen and select the apprentice candidate or candidates.
- Register the selected apprentice with SOLAS.
- The Apprentice Coordinator supports employers throughout these stages.
Employer approval and registration normally need to be completed only once, making subsequent apprentice recruitment more straightforward.
The importance of the workplace mentor
The mentor is critical to the apprentice’s experience and successful development. This is more than an administrative role. A good mentor provides continuity, practical guidance and regular feedback, helping the apprentice connect academic learning with everyday operations. Mentoring should be collaborative and responsive to the apprentice’s needs, while encouraging reflection, accountability and steady professional growth.
This support is particularly important for school leavers and career changers who may have limited previous exposure to commercial transport.
Employers should select a mentor who understands the operation, communicates well and has sufficient time to support the apprentice. Regular check-ins, clear expectations and early intervention where difficulties arise can strengthen retention and help apprentices develop into safe, confident and capable professional drivers.
Part of a wider workforce strategy
Apprenticeships cannot resolve the driver shortage on its own. Employers and policymakers must also address working conditions, driver welfare facilities, competitive pay and benefits, predictable and flexible rosters, licensing and training barriers, and the public perception of commercial driving as a career.
Technology is also reshaping the profession. Telematics, digital compliance tools, advanced driver-assistance systems, intelligent routing and AI-supported fleet management can improve safety and efficiency, but they create new skills and responsibilities. The apprenticeship must continue to evolve alongside these changes and maintain strong engagement with employers, apprentices and the programme’s academic partner.
For employers, apprenticeships should not be viewed simply as a response to an immediate vacancy. They are a long-term investment in workforce capability, succession planning and supply-chain resilience. By providing a recognised qualification, structured workplace experience and a clear career route, the Transport Operations and Commercial Driving Apprenticeship can help build a sustainable domestic talent pipeline and reinforce commercial driving as a skilled, respected and rewarding profession.
For further information, visit www.cdap.ie or email [email protected].
Training
Operators of commercial vehicle fleets in Ireland provide their drivers with, on average, just over two-and-a-half days training per year (2.6). Management staff, defined as Transport Managers, Transport Planners, Transport Supervisors and Other Administration staff, on average, receive three day’s training per year. Both of these figures are in line with responses received in 2025 and are below the eight-year average trends of 4.2 and 4.6 days respectively.
Training and HR expenditure
Across our research respondents, the composition of which changes from year to year, the average spend per company on staff training per year is somewhat higher in 2026, at €23,055 although at €252, spend per company employee (excluding agency workers) is lower. As highlighted by respondents, types of training offered to staff include, but are not limited to:
- ADR
- Health and Safety
- Collection & Delivery SOPs
- IT / Software
- CPC
- Manual handling
- Driver training
- Personal development
- ECO driving
- Quality Management
- Fire safety
- Risk assessment
- First Aid
- Road safety
- Fleet compliance
- Tachograph
- Food safety
- Wellbeing
- Forklift
- Working time directive
For the first time in our series of reports, this year we asked respondents specifically about their provision of cyber risk training.
It is good to see that over one-half of respondents (55.6%) provide a regular training programme, whilst a further 22.2% suggest that their training on this topic is occasional / ad hoc. There is still work to do for the 22.2% of respondents stating that they do not provide cyber risk training to their employees.
Expenditure by fleet operators on HR is €38,500 on average. This includes allocating costs to the salaries of HR department staff (or costs of another staff member undertaking relevant activity as part of their role), external recruitment costs and training costs etc.
Vacancies
We have already noted that 71.4% of respondents believe that the recruitment environment, and their company’s ability to recruit, is impacting the growth of their businesses and 76.9% see it impacting their day-to-day operations.
Our respondents were asked to estimate costs to their company incurred in the last 12 months as a direct consequence of any skills shortages within their business. On average, it is costing companies €16,667 per year to try and overcome, or find alternative, more costly solutions, to their skills shortages.
It takes commercial vehicle operators over six working weeks (30.7 days) to fill driver vacancies within their business, up from 29.8 days last year, with big variations noted amongst our respondents, from as little as 2-3 days to 60 days and more. Turnover rates for drivers are averaging 8.0% this year, up from 4.3% in 2024 and 7.6% last year, as labour markets remain competitive.
Our analysis also identifies that 6.7% of driver positions remain unfilled this year (down from 8.2% last year), with 1.9% of all staff positions across a company remaining open. The share of all employment vacancies accounted for by drivers is 75.7%, down marginally from 78.3% in 2025.
The list of challenges encountered by fleet operators when trying to hire drivers is a lengthy one, but among the most common obstacles highlighted by our respondents are:
- Competitive job market
- Lack of trained drivers
- Drivers exiting the sector to seek a better work/life balance
- Money, salaries offered both in other sectors and by competitors
- Fewer young people driving resulting in a lack of young drivers available to hire
- Lack of suitably qualified candidates (particularly in ADR)
- For foreign national drivers, rates of pay in their home countries has increased, discouraging them from travelling to other countries for work
81.8% of respondents stated that they offer additional benefits or incentives, over and above salaries, in their attempts to attract and retain talent.
New to our research this year we asked companies how, if at all, they review their labour and employment arrangements against the Revenue 5 step employment status framework. Just under one-half of respondents (45.4%) were not aware or have not reviewed their arrangements. The remaining respondents are split, in three equal measures, between fully, partially and being aware of – but not reviewing, their arrangements. It is important to note that these datapoints reflect one-years’ worth of responses only, and it will be of interest to gauge how these metrics evolve in subsequent editions of the report.
Apprenticeships
Apprenticeships overcome labour and skills shortages by providing a pathway to train new talent with the specific skills an employer needs, while also retaining and developing existing employees. They are used to bridge the gap between education and employment, ensuring that the skills learned are directly relevant to the workplace. This approach allows businesses to build a pipeline of skilled workers
Following up on our initial research last year, we have once again looked to understand fleet operators’ relationships with apprenticeship schemes.
90.9% of companies are aware of existing apprenticeship programmes available in the logistics sector i.e. Entry level LAA and CDAP programmes.
Under one-half (45.5%) currently offer apprenticeship schemes as part of their recruitment / talent development strategy.
Almost three-quarters of companies (72.7%) are interested in facilitating apprenticeships to assist with overcoming recruitment challenges and retention / development of talent.
81.8% of our respondents are aware of the Government funding available (Apprenticeship Grants) to support Employers involved in the apprenticeships.
Domestic service areas
For the sixth time in our report series, we asked respondents about their use and satisfaction with domestic service areas and overnight accommodation for drivers of commercial vehicles in Ireland.
Two-thirds of our respondents make use of domestic facilities and / or utilise overnight accommodation services on a daily basis.
One-third of our respondents (36.4%) suggest that they have consistently adequate access to welfare facilities on their routes (toilets, showers, parking, rest areas). A similar share suggest that access is ‘usually’ adequate, whilst 18.1% state access is often inadequate and 9.1% believe access is rarely or never adequate.
Satisfaction levels with domestic service areas and overnight accommodation are higher than previous years’ research but rated only 6.8 out of ten in 2026, up from 6.6 in 2025.
27.3% of respondents stated that inadequate facilities affect their compliance with Driving Hours Regulations (DHR) or Working Time Directive (WTD), 9.1% on a frequent basis and 18.2% on an occasional basis. 54.5% of respondents stated that this is rarely the case.
__________________________________________________________________________________________________________________
__________________________________________________________________________________________________________________
Data Tables
(Download the free report to access all the data tables listed below)
- Table 01 Research respondents by category Page 60
- Table 02 Respondents’ operating attributes Page 60
- Table 03 Change in business overhead costs Page 60
- Table 04 Financial performance metrics Page 61
- Table 05 Change in transport overhead costs Page 61
- Table 06 Change in haulage rates Page 61
- Table 07 Buyers of haulage services Page 61
- Table 08 Providers of haulage services Page 62
- Table 09 Change in maintenance costs Page 62
- Table 10 Maintenance costs Page 63
- Table 11 Change in fuel costs Page 63
- Table 12 Change in fuel costs Page 63
- Table 13 Change in fuel prices Page 64
- Table 14 Breakdown of operating costs: Rigid vehicles 3.5 - 18.0 Tonnes GVW Page 64
- Table 15 Breakdown of operating costs: 46 Tonnes articulated vehicles Page 64
- Table 16 Impact of fuel price changes on operating costs Page 64
- Table 17 Adjusting fuel pricing or surcharge as a result of a change in fuel prices Page 65
- Table 18 Use and management of fuel baselines in contracts Page 65
- Table 19 Company approaches to the Road Transport Support Scheme (RTSS) Page 65
- Table 20 In direct response to the crisis in the Middle East Page 65
- Table 21 Truck purchasing costs Page 66
- Table 22 Type of motor insurance Page 66
- Table 23 Timing of motor insurance renewals Page 66
- Table 24 Average insurance premiums per vehicle Page 66
- Table 25 Motor insurance premiums by vehicle type Page 67
- Table 26 Change in motor insurance premiums Page 67
- Table 27 Efforts to reduce motor insurance premiums Page 67
- Table 28 Optimisation of working capital Page 68
- Table 29 Cashflow challenges Page 68
- Table 30 Monthly cashflow challenges Page 68
- Table 31 Cashflow solutions Page 69
- Table 32 Undertaking staff scenario planning Page 69
- Table 33 Frequency of staff scenario planning Page 69
- Table 34 Recruitment challenges Page 69
- Table 35 Succession planning Page 70
- Table 36 Leadership and governance Page 70
- Table 37 Capex funding Page 70
- Table 38 Capex growth Page 70
- Table 39 Areas of investment Page 71
- Table 40 Time of peak capital expenditure Page 71
- Table 41 Sustainability policies Page 72
- Table 42 Sustainability motivation Page 72
- Table 43 Sustainability credentials Page 72
- Table 44 Sustainability challenges Page 73
- Table 45 Sustainability ROI Page 73
- Table 46 Investing in sustainability initiatives Page 73
- Table 47 Sustainability investment Page 74
- Table 48 Sustainability recruitment Page 74
- Table 49 Sustainability recruitment Page 74
- Table 50 Climate risk Page 74
- Table 51 Future energy requirements Page 75
- Table 52 Key metrics: 3.5 Tonnes vans GVW Page 76
- Table 53 Key costs per vehicle: 3.5 Tonnes vans GVW Page 76
- Table 54 Key metrics: Rigid vehicles 3.5 - 18.0 Tonnes GVW Page 77
- Table 55 Key costs per vehicle: Rigid vehicles 3.5 - 18.0 Tonnes GVW Page 77
- Table 56 Key metrics: 46 tonnes articulated vehicles (3 axle tractor unit) Page 77
- Table 57 Key costs per vehicle: 46 tonnes articulated vehicles Page 78
- Table 58 Distance by vehicle type Page 78
- Table 59 Age by vehicle type Page 78
- Table 60 Maintenance costs by vehicle type Page 78
- Table 61 Maintenance costs by vehicle fuel type Page 78
- Table 62 Maintenance source by vehicle type Page 79
- Table 63 Types of tyres primarily used Page 80
- Table 64 Increasing tyre lifecycles Page 80
- Table 65 Fuel costs by vehicle type Page 80
- Table 66 Depreciation costs by vehicle type Page 80
- Table 67 Annual insurance premiums by vehicle type Page 81
- Table 68 Vehicle procurement decision-making Page 81
- Table 69 Importance of price in Truck purchasing Page 81
- Table 70 Companies exploring alternative fuels Page 81
- Table 71 If not operating alternatively fuelled vehicles, when do you expect to do so Page 82
- Table 72 Anticipated growth of alternatively fuelled fleets Page 82
- Table 73 Satisfaction with alternatively fuelled vehicles Page 82
- Table 74 Barriers to transitioning to new fuels Page 83
- Table 75 Alternative fuelled vehicles costs and saving strategies Page 83
- Table 76 Reporting and monitoring fuel consumption Page 83
- Table 77 Use of fuel data Page 84
- Table 78 Transport management and planning Page 84
- Table 79 Transport management and planning costs Page 84
- Table 80 Action and incentives to save fuel Page 84
- Table 81 Driver Ecodrive training Page 85
- Table 82 Use of DoT HGV Ecodriving standard schemes Page 85
- Table 85 Total cost savings from use of Ecodrive or similar training Page 85
- Table 84 Incentives levels to save fuel Page 85
- Table 85 Drivers' employment status Page 86
- Table 86 Drivers' gender Page 86
- Table 87 Drivers' age Page 86
- Table 88 Drivers’ salaries Page 86
- Table 89 Drivers’ holiday entitlement Page 87
- Table 90 Drivers’ holiday entitlement Page 87
- Table 91 Drivers’ nationality Page 87
- Table 92 3.5 Tonnes vans GVW drivers - wages & hours Page 87
- Table 93 Rigid vehicle drivers - wages & hours Page 88
- Table 94 Articulated vehicle drivers - wages & hours Page 88
- Table 95 Drivers’ weekly wages by vehicle type - basic Page 88
- Table 96 Drivers’ weekly wages by vehicle type - gross Page 89
- Table 97 Transport staff employment status Page 89
- Table 98 Transport management staff by gender Page 89
- Table 99 Transport staff salaries Page 89
- Table 100 Transport staff nationality Page 89
- Table 101 Transport manager salaries Page 90
- Table 102 Transport planner salaries Page 90
- Table 103 Average training volume by role Page 90
- Table 104 Provision of cyber risk training Page 90
- Table 105 Training and HR costs Page 91
- Table 106 Skills shortages Page 91
- Table 107 Staff turnover rates Page 91
- Table 108 Staff vacancy rates Page 91
- Table 109 Attracting and retaining talent Page 91
- Table 110 Companies awareness of apprenticeship schemes Page 92
- Table 111 Review of employment arrangements against the 5 step framework Page 92
- Table 112 Driver access to adequate welfare facilities on their routes Page 92
- Table 113 Domestic service areas / overnight accommodation Page 93
- Table 114 Do inadequate facilities affect compliance with DHR or WTD Page 93
Market Data Appendix
(Please download the free report to access the market data)
To provide context to our research findings, the following key data points relevant to the operation of commercial vehicle fleets in Ireland are provided. This includes…
- Fleet population
- First time licensing (by manufacturer)
- Vehicle licenses
- Fleet fuel types
- New vehicles licensed by fuel type
- Fleet licenses and sizes
- Motor tax rates
- Inflation
- Fuel costs
- Road freight activity
Now in it's 8th edition
Contact us to access copies from previous years

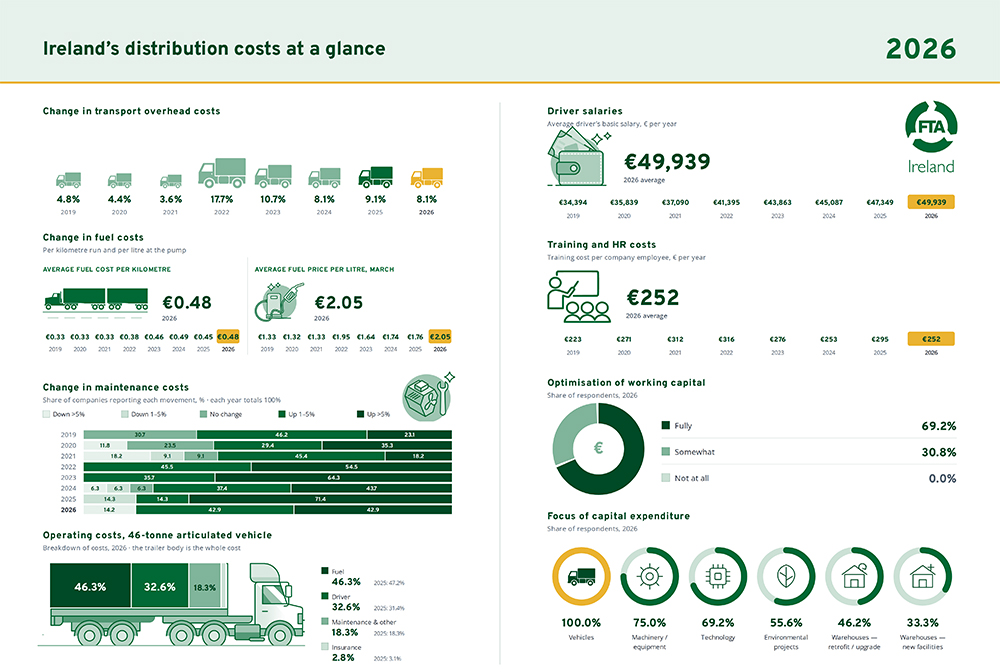
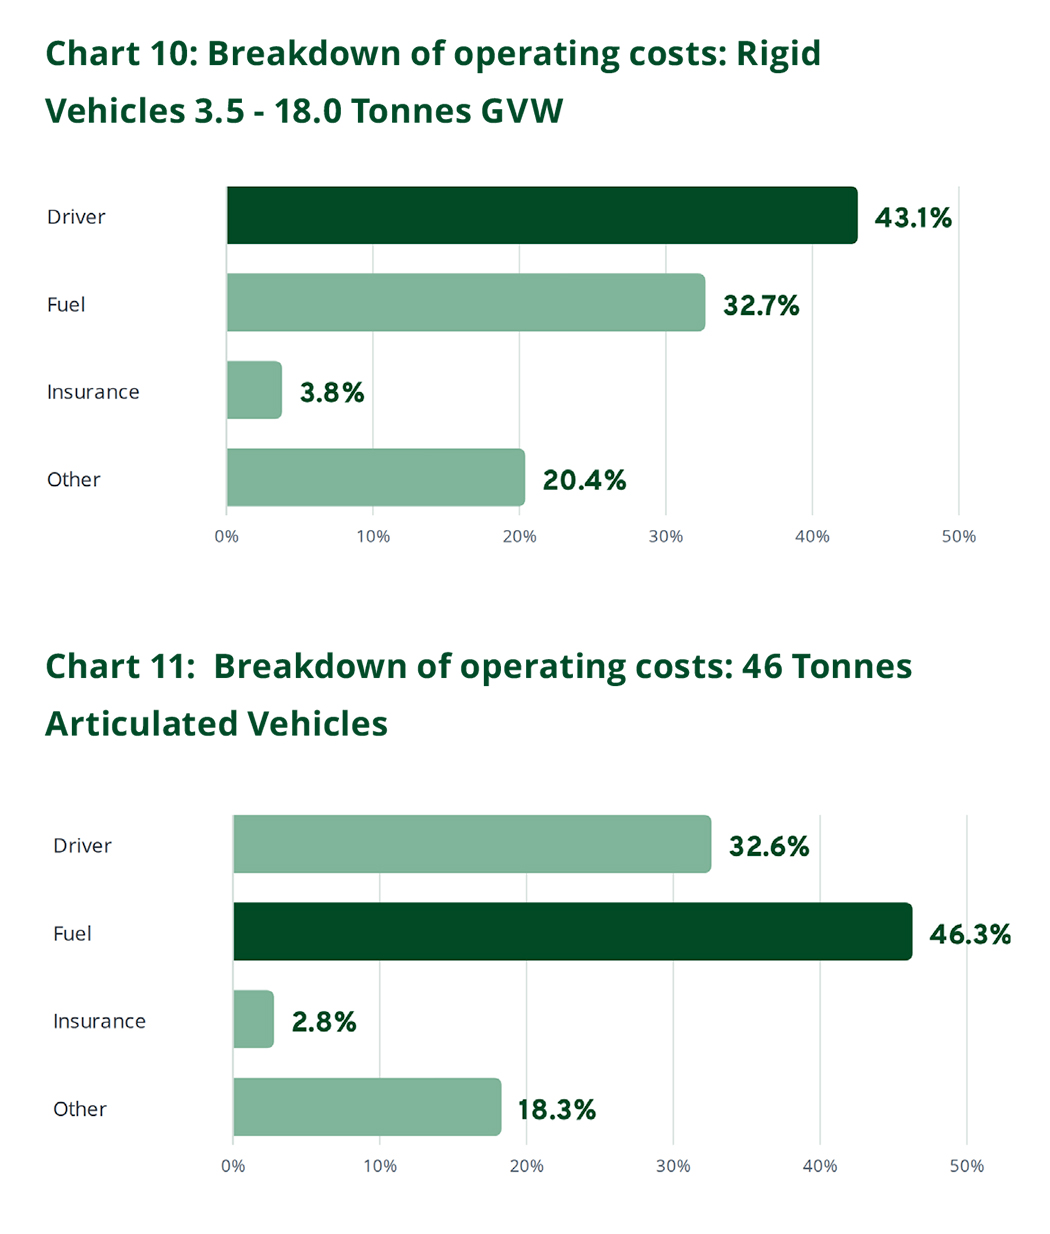 .
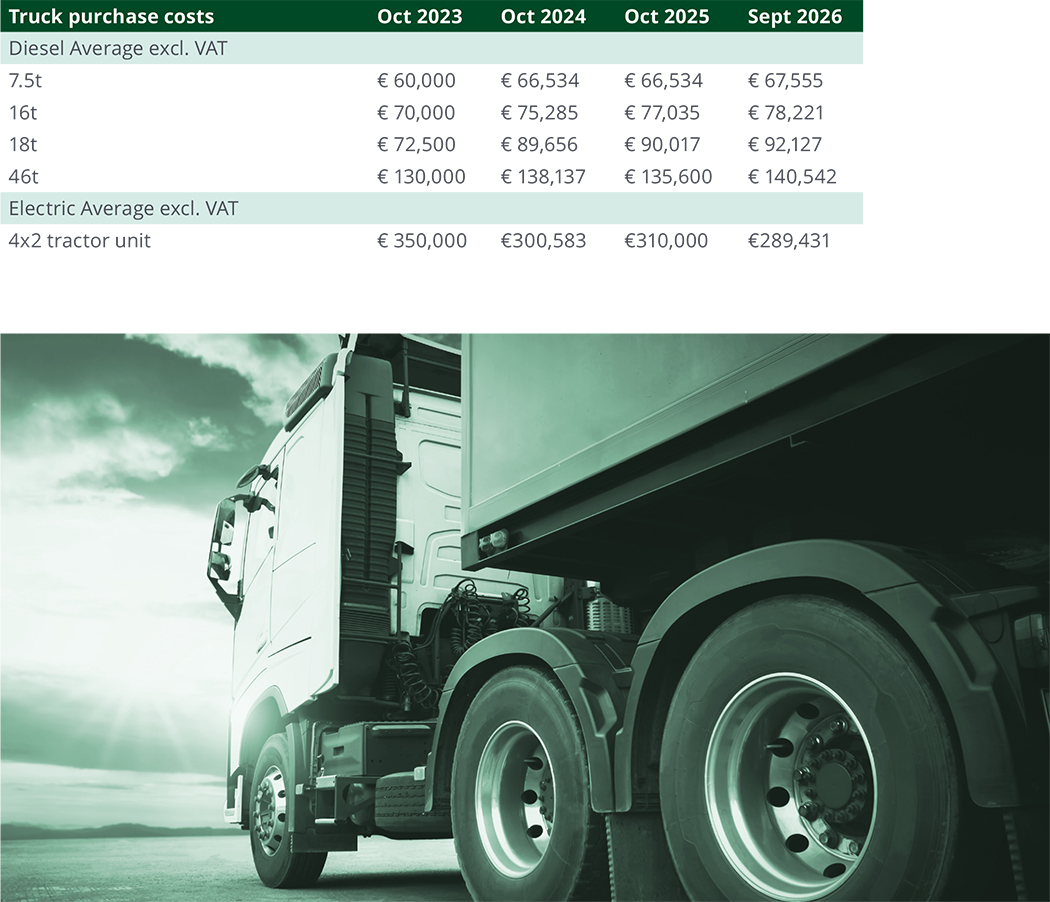
About FTA Ireland
The Freight Transport Association Ireland CLG is a not-for-profit membership trade association for the Irish freight and logistics industry. Wholly owned and governed by members the association acts solely in advancing their best interests covering all aspects of private and public freight transport, passenger transport and logistics and supply chain sectors, including road, rail, sea and air.

About ECOfleet
ECOfleet is Ireland’s largest green freight programme, delivered with FTA Ireland’s green accreditation scheme. Fleets baseline their fuel and electricity use, act on an agreed plan, and have the savings independently measured and verified per kilometre and per tonne-kilometre (or per passenger.km).
https://ecofleet.ie/

About Allied Irish Banks (AIB)
Allied Irish Banks (AIB) is a major financial services group operating predominantly in the Republic of Ireland and the UK, offering a comprehensive range of services to retail, business, and corporate customers. It is one of Ireland's largest banks, with a history dating back to 1825, and its operations include commercial banking, financing, and investment.
Get in touch